Trade Results
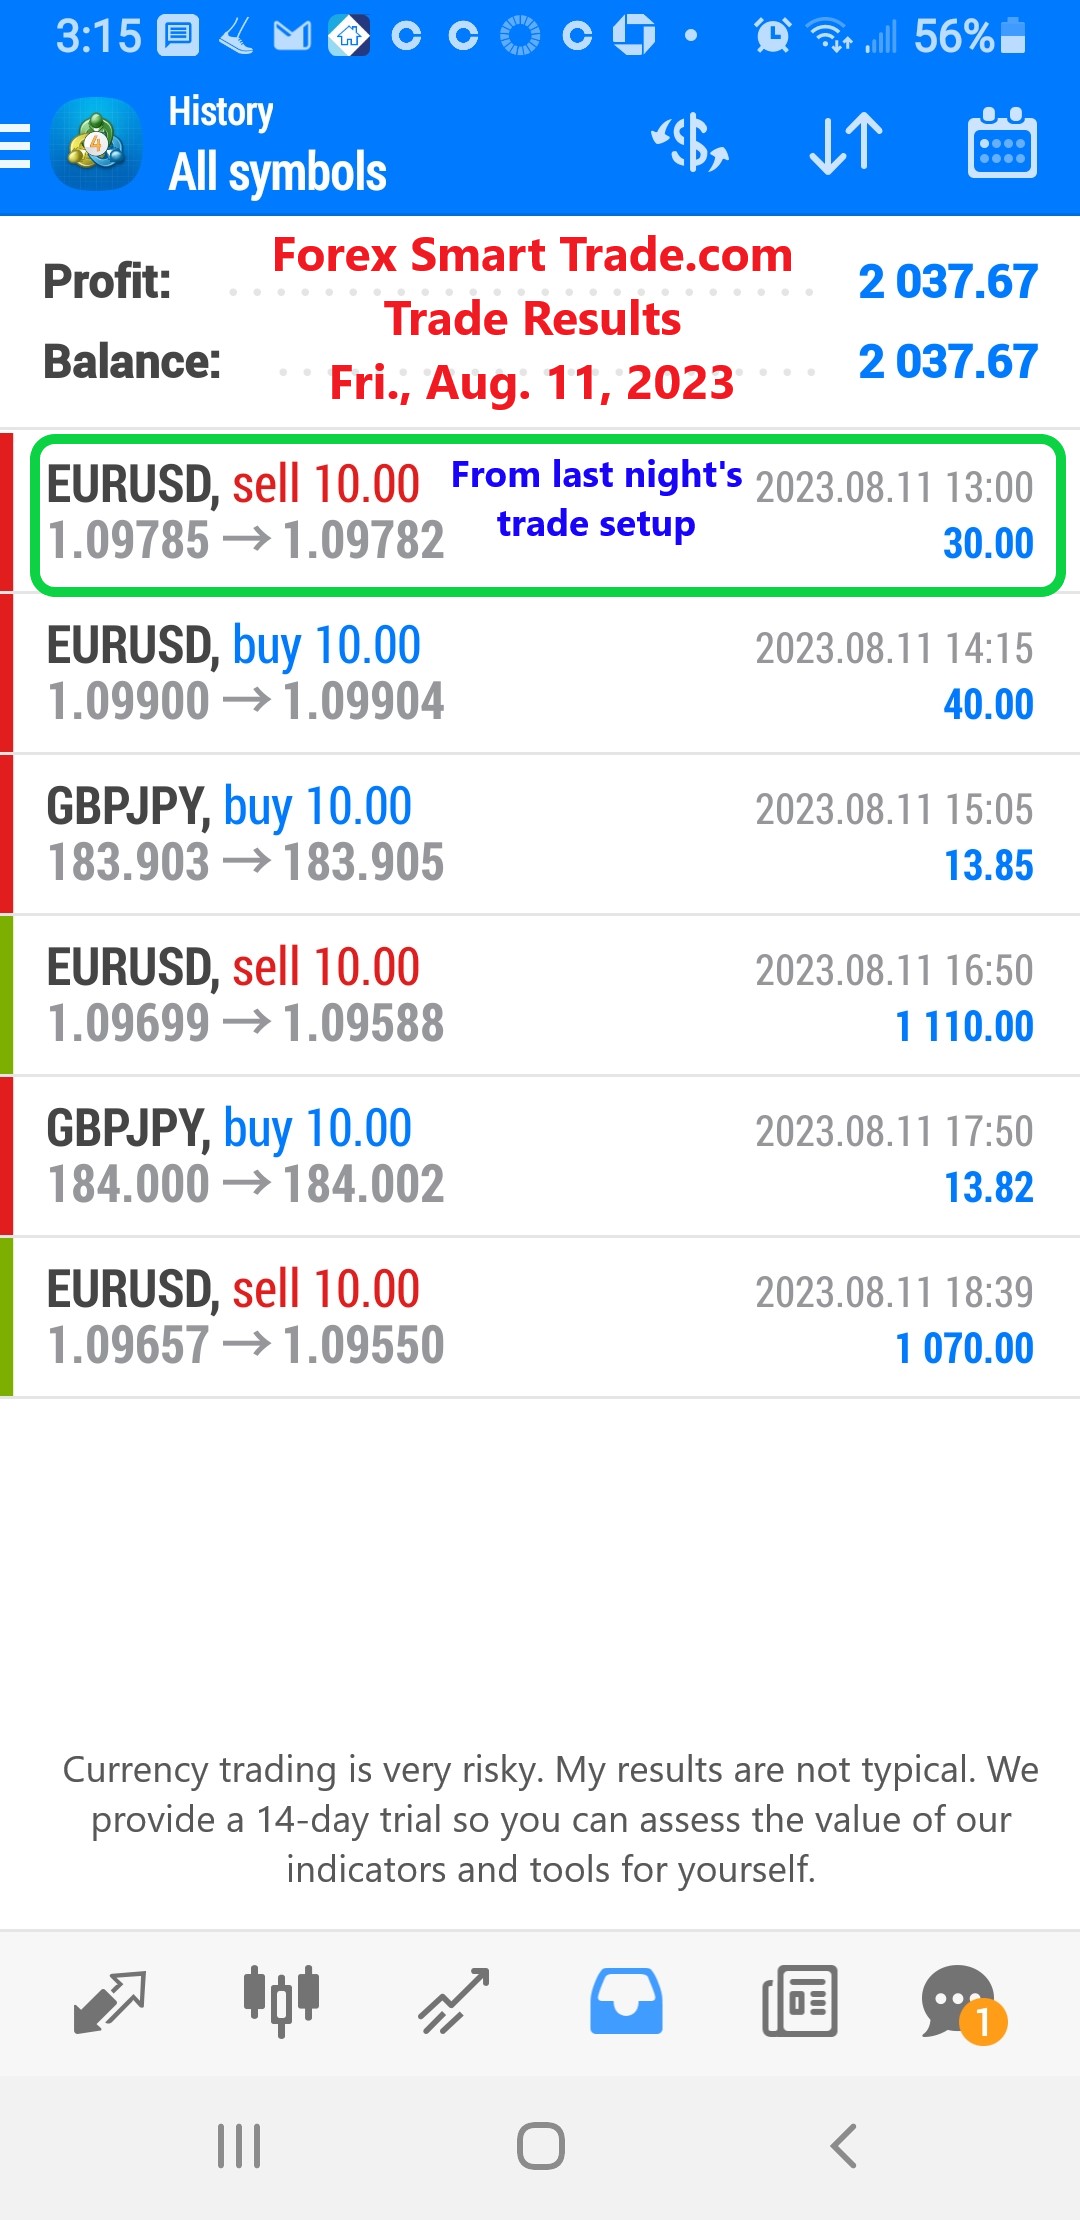
Forex Smart Trade Results, Friday, August 11, 2023 – $2,037
Symmetrical Triangle. A symmetrical triangle is a chart formation where the slope of the price’s highs and the slope of the price’s lows converge together to a point […]
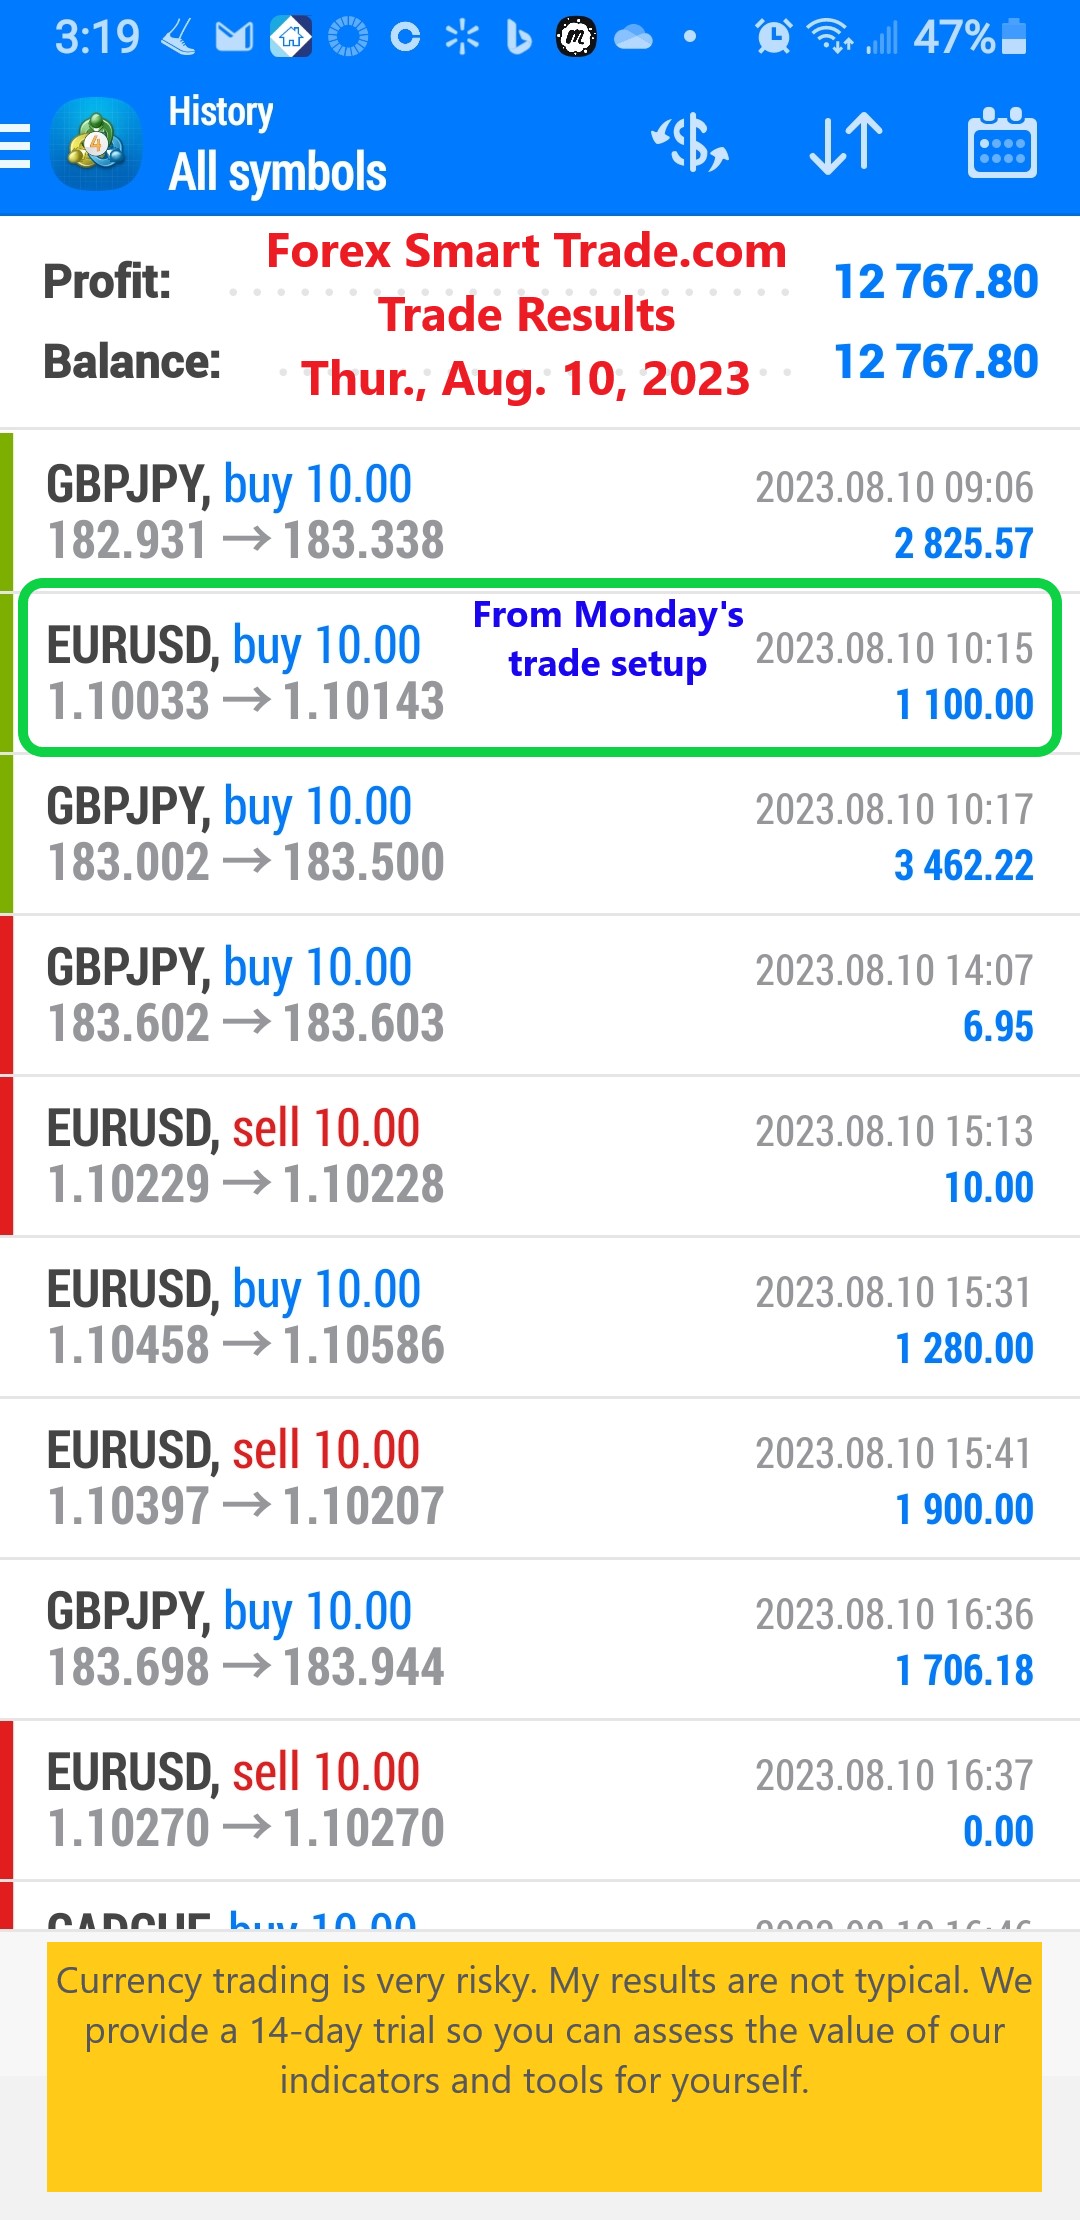
Forex Smart Trade Results, Thursday, August 10, 2023 – $12,767
How to Trade Triangle Chart Patterns. Let’s examine how to trade triangle chart patterns. A triangle chart pattern involves price moving into a tighter and tighter […]
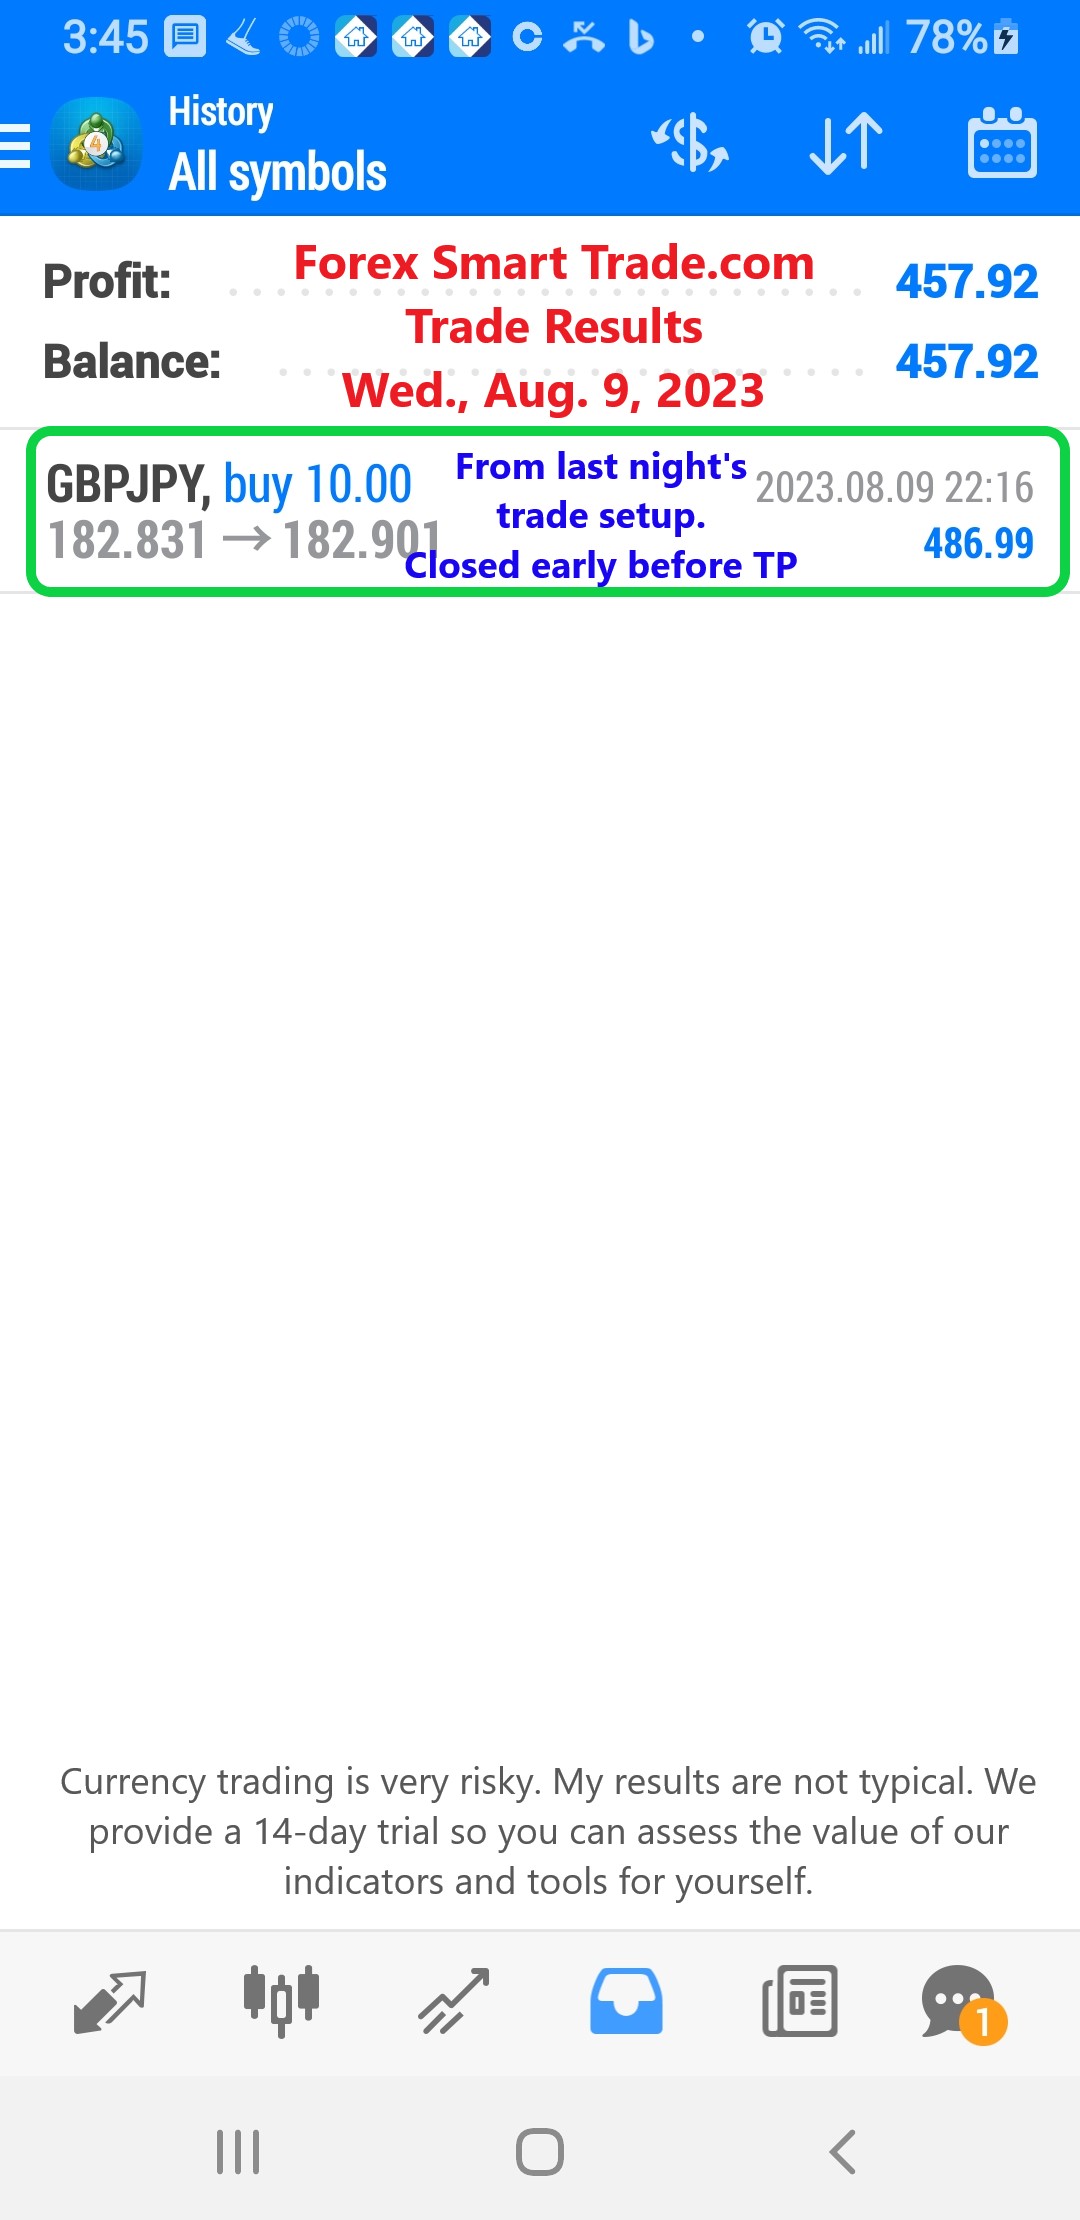
Forex Smart Trade Results, Wednesday, August 9, 2023 – $457
Bullish Pennants. Now let’s take a look at bullish pennants. Bullish pennants, just like its name suggests, signals that bulls are about to go a-chargin’ again. […]
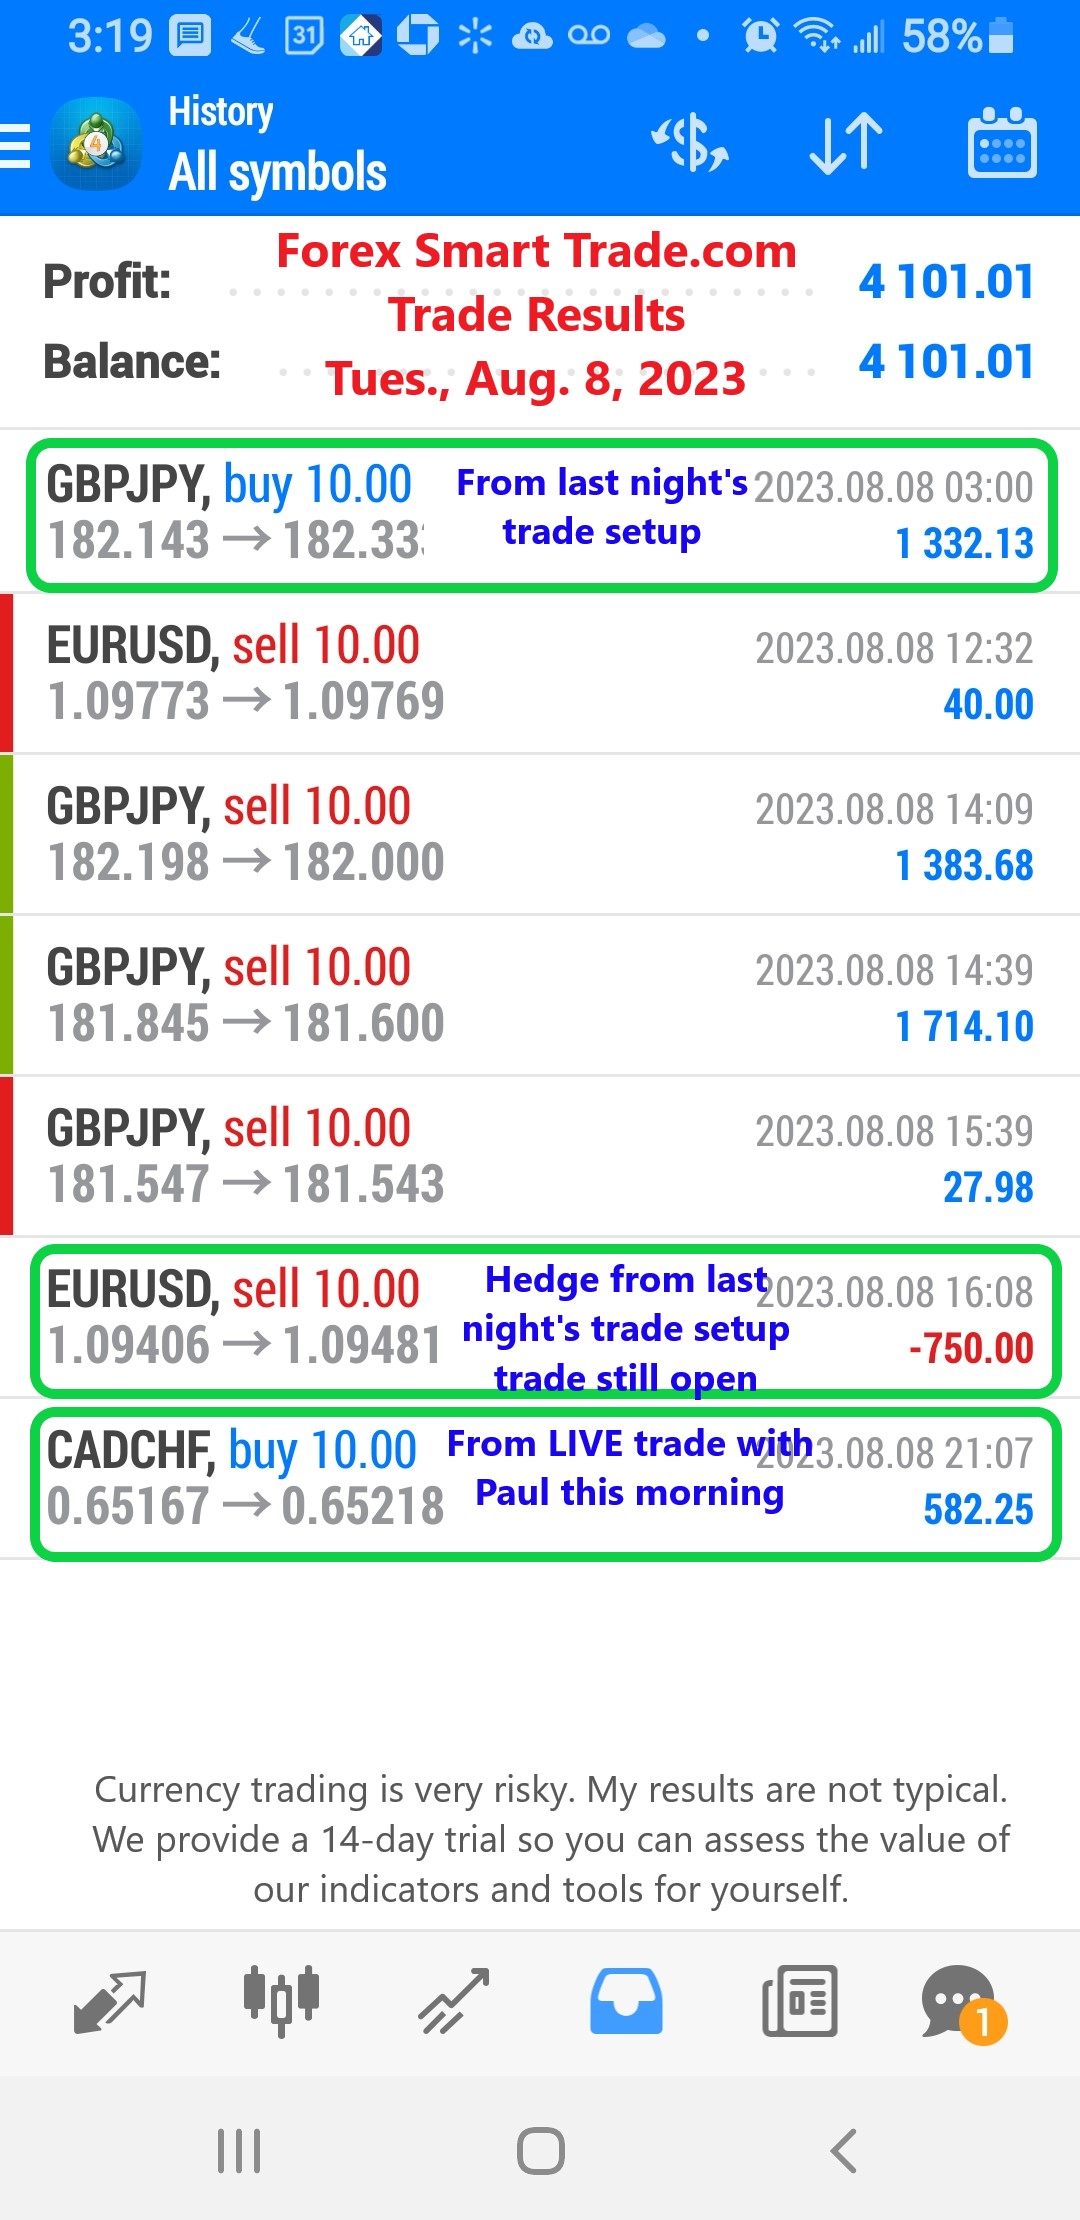
Forex Smart Trade Results, Tuesday, August 8, 2023 – $4,101
How to Trade Bearish and Bullish Pennants. Let’s take a look at how to trade bearish and bullish pennants. Similar to rectangles, pennants are continuation chart […]
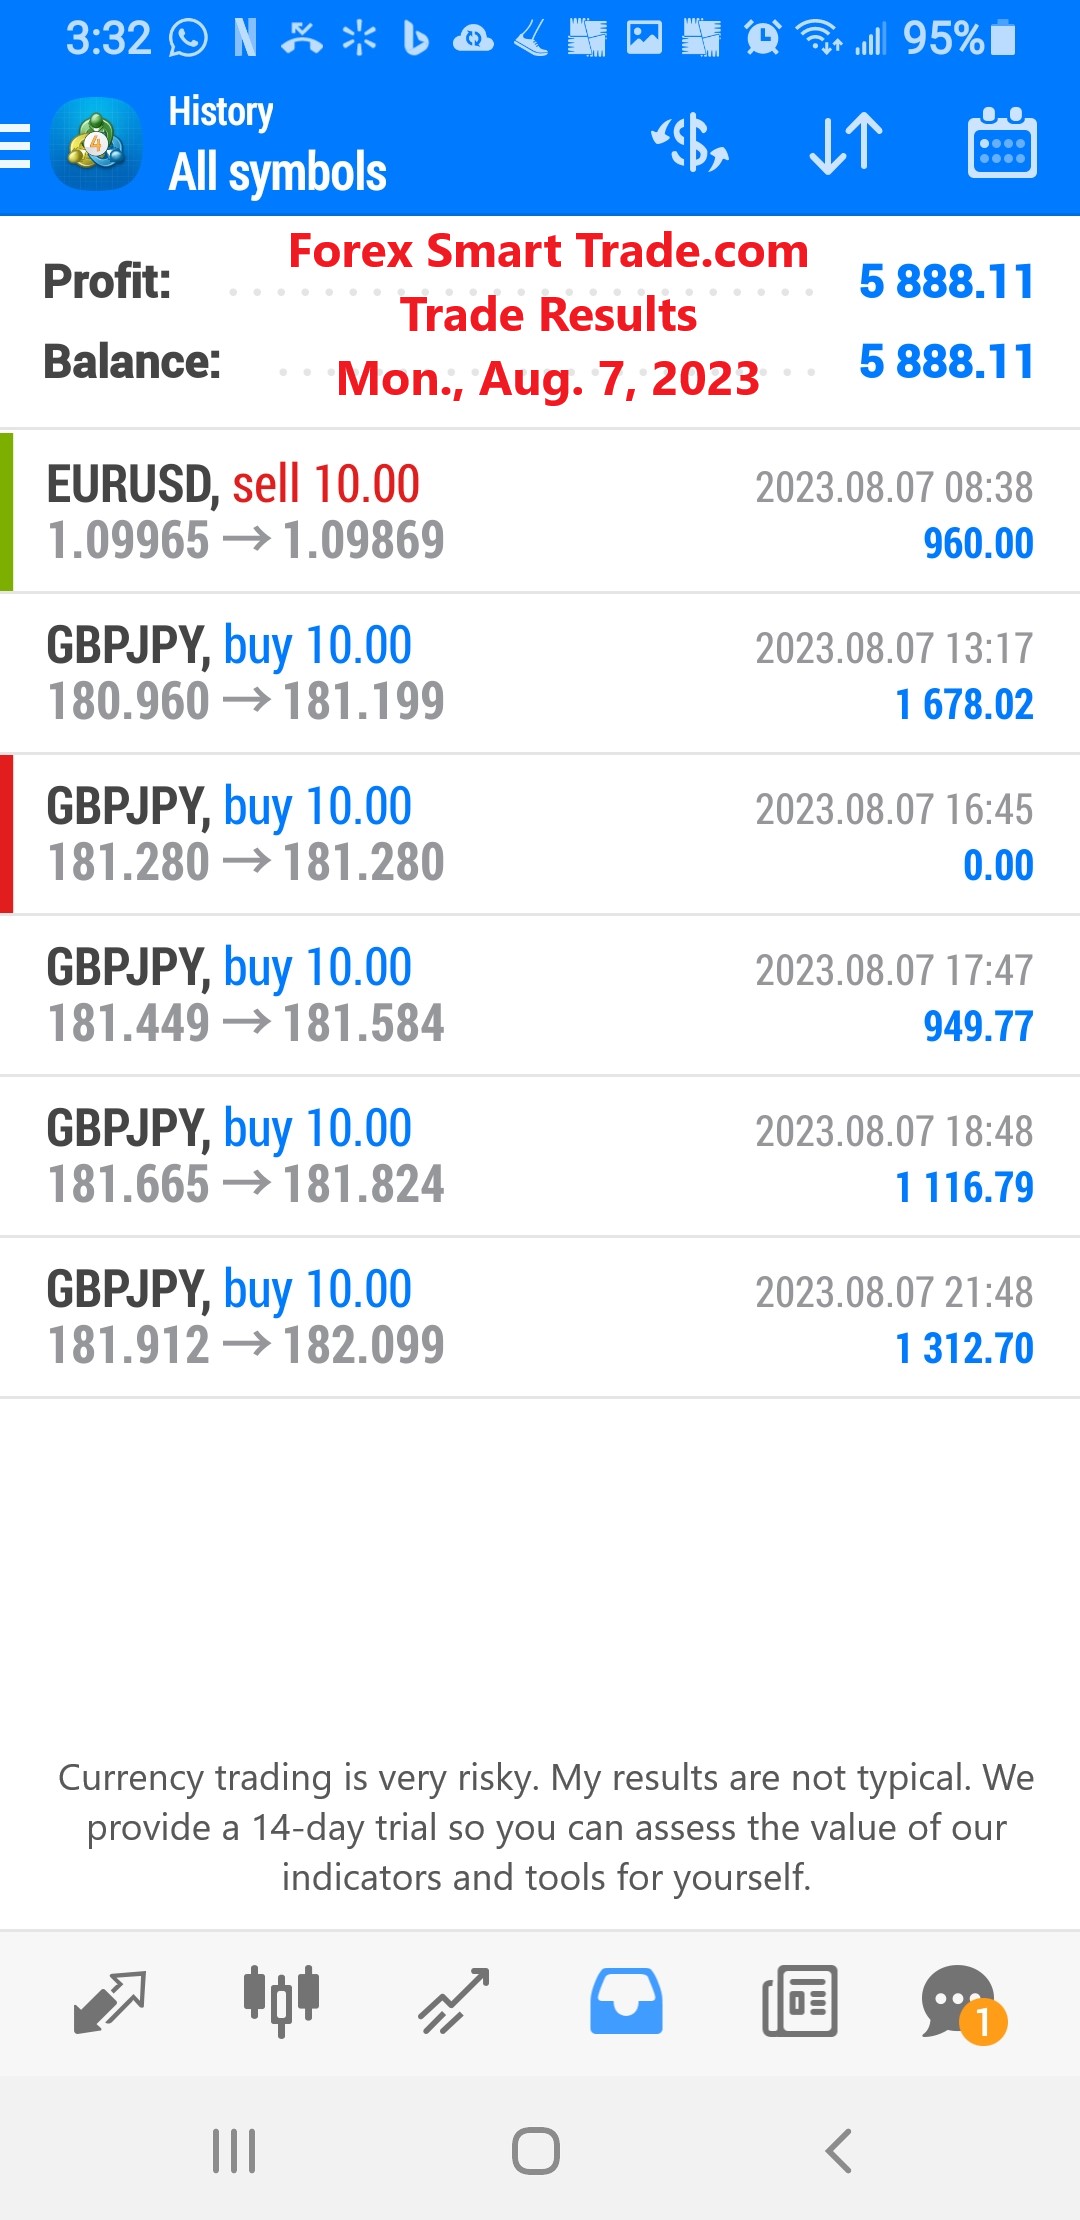
Forex Smart Trade Results, Monday, August 7, 2023 – $5,888
Bearish Rectangle. A bearish rectangle is formed when the price consolidates for a while during a downtrend. This happens because sellers probably need to pause and catch their […]
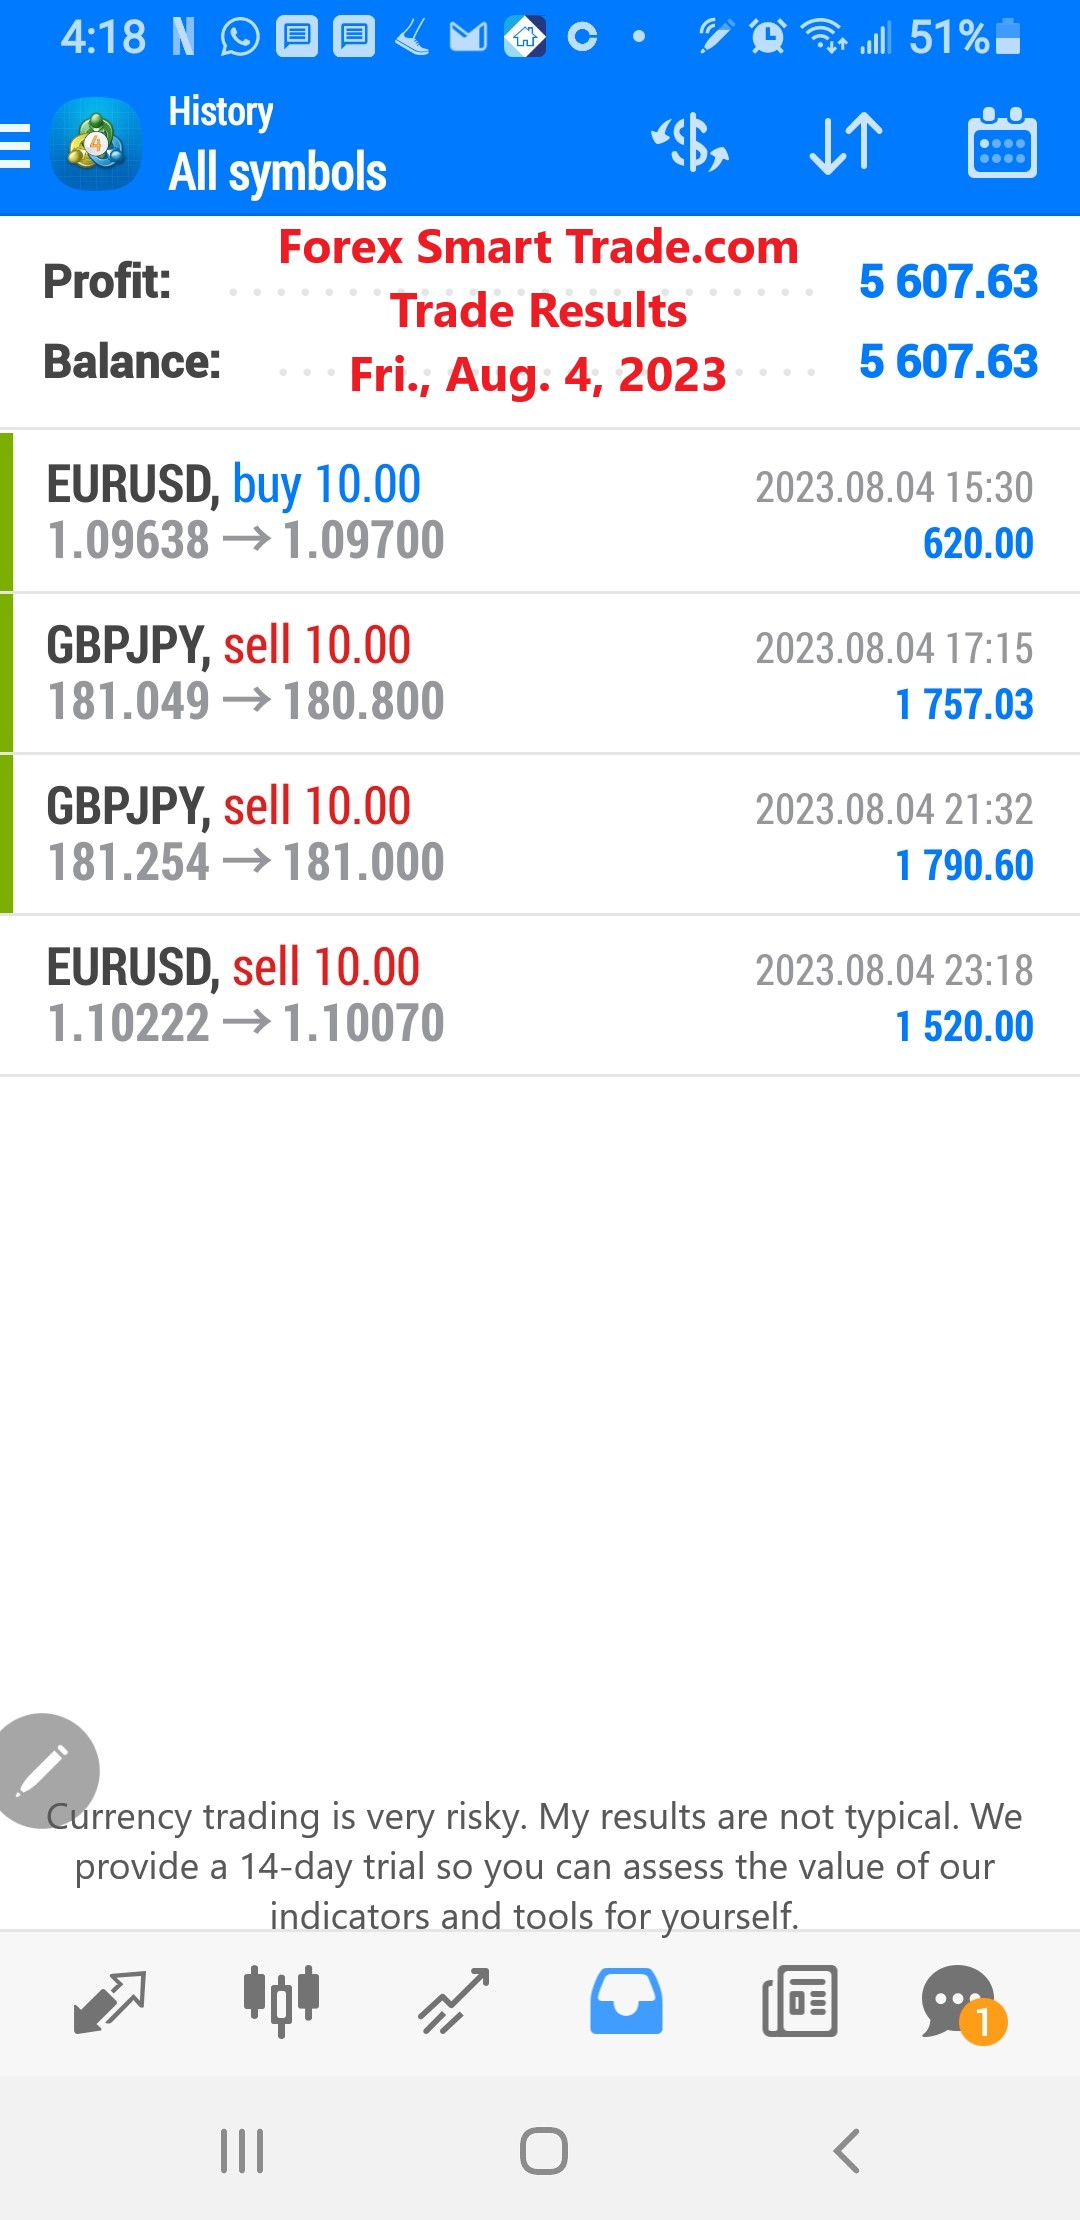
Forex Smart Trade Results, Friday, August 4, 2023 – $5,607
Rectangle Chart Patterns to Trade Breakouts. Let’s look at how to use rectangle chart patterns to trade breakouts. What is a rectangle chart pattern? A rectangle is […]
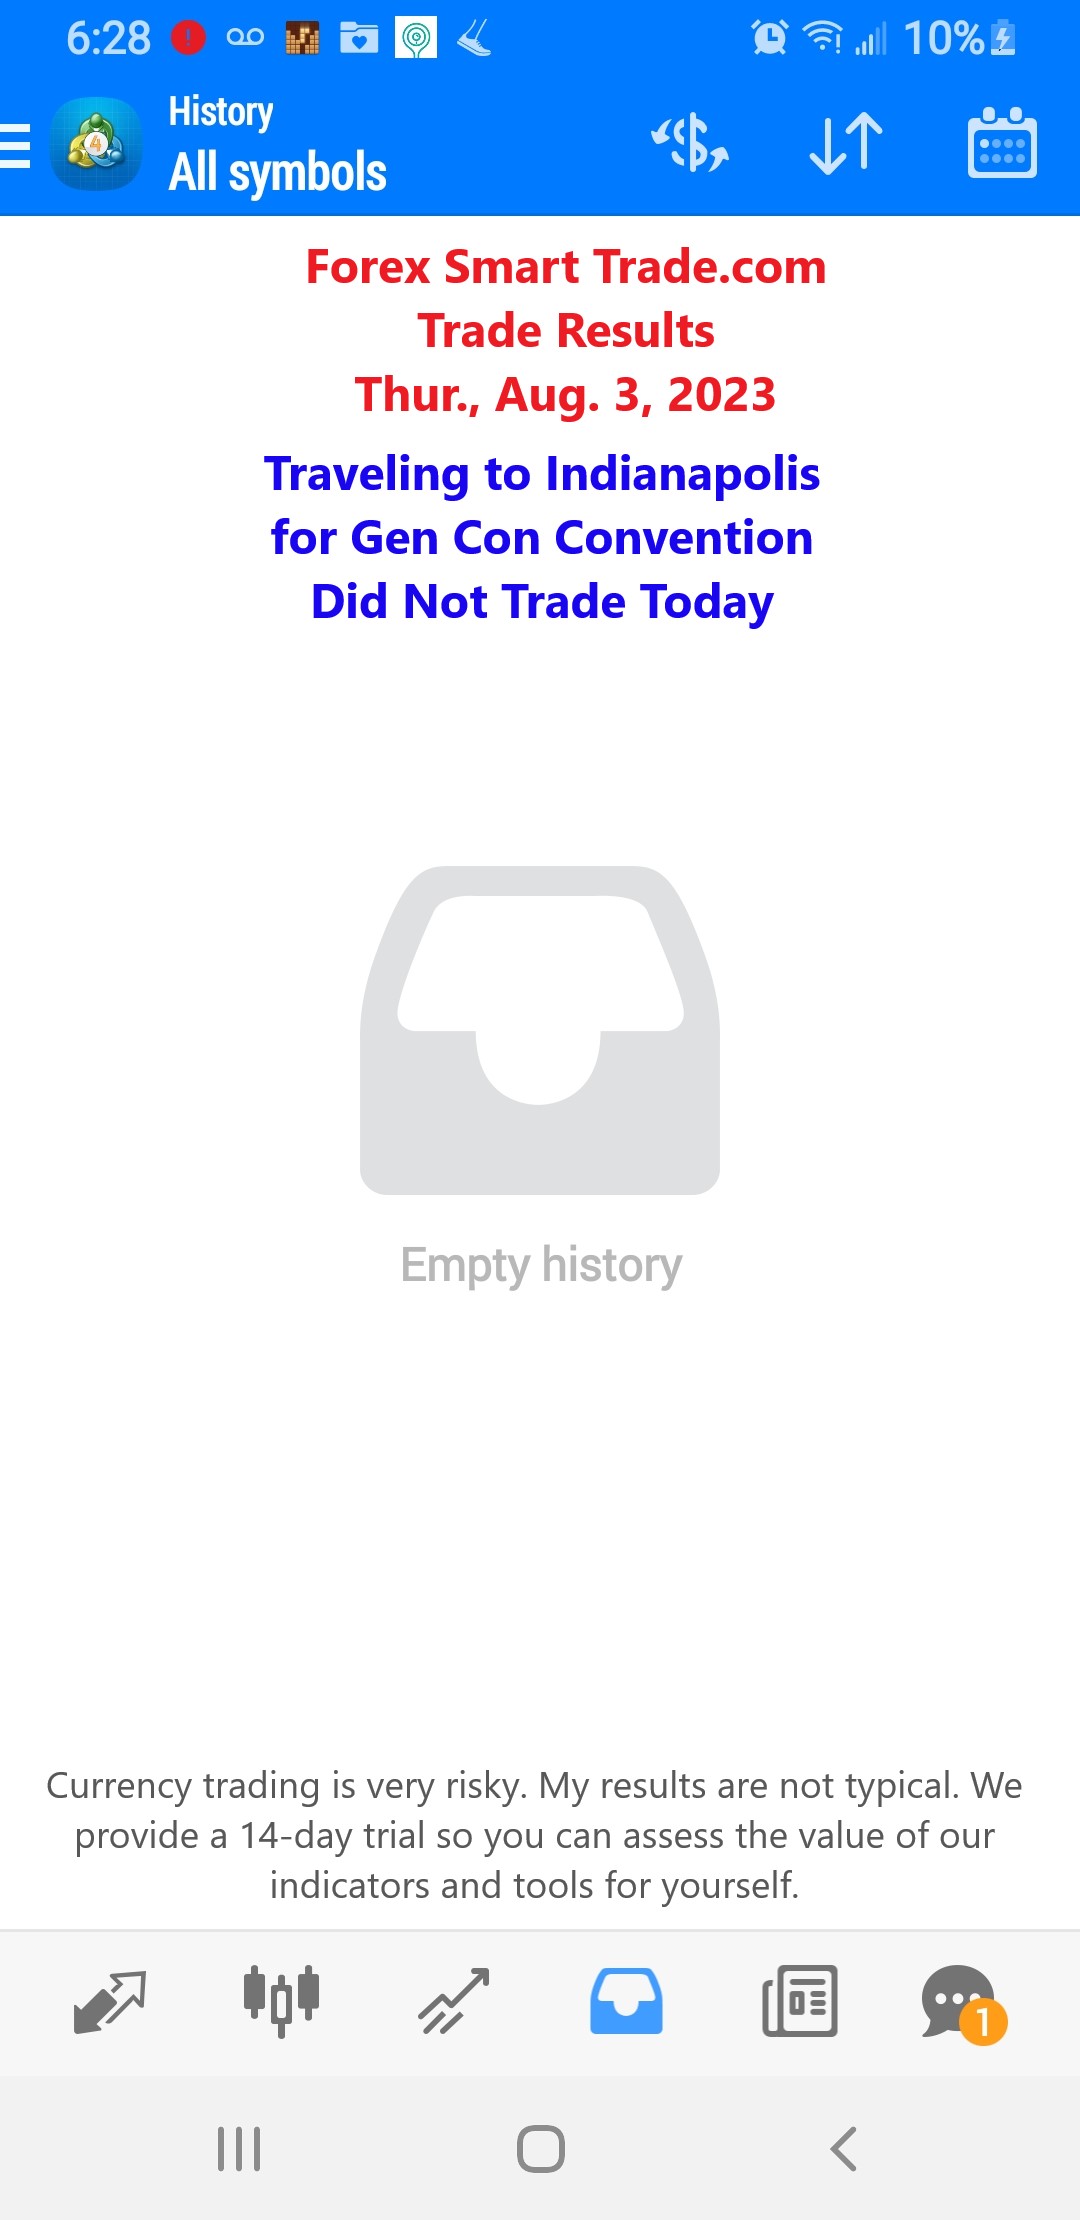
Forex Smart Trade Results, Thursday, August 3, 2023 – Did Not Trade Today – Travel to Indianapolis for Gen Con
Falling Wedge. Just like the rising wedge, the falling wedge can either be a reversal or continuation signal. As a reversal signal, they form it at the bottom […]
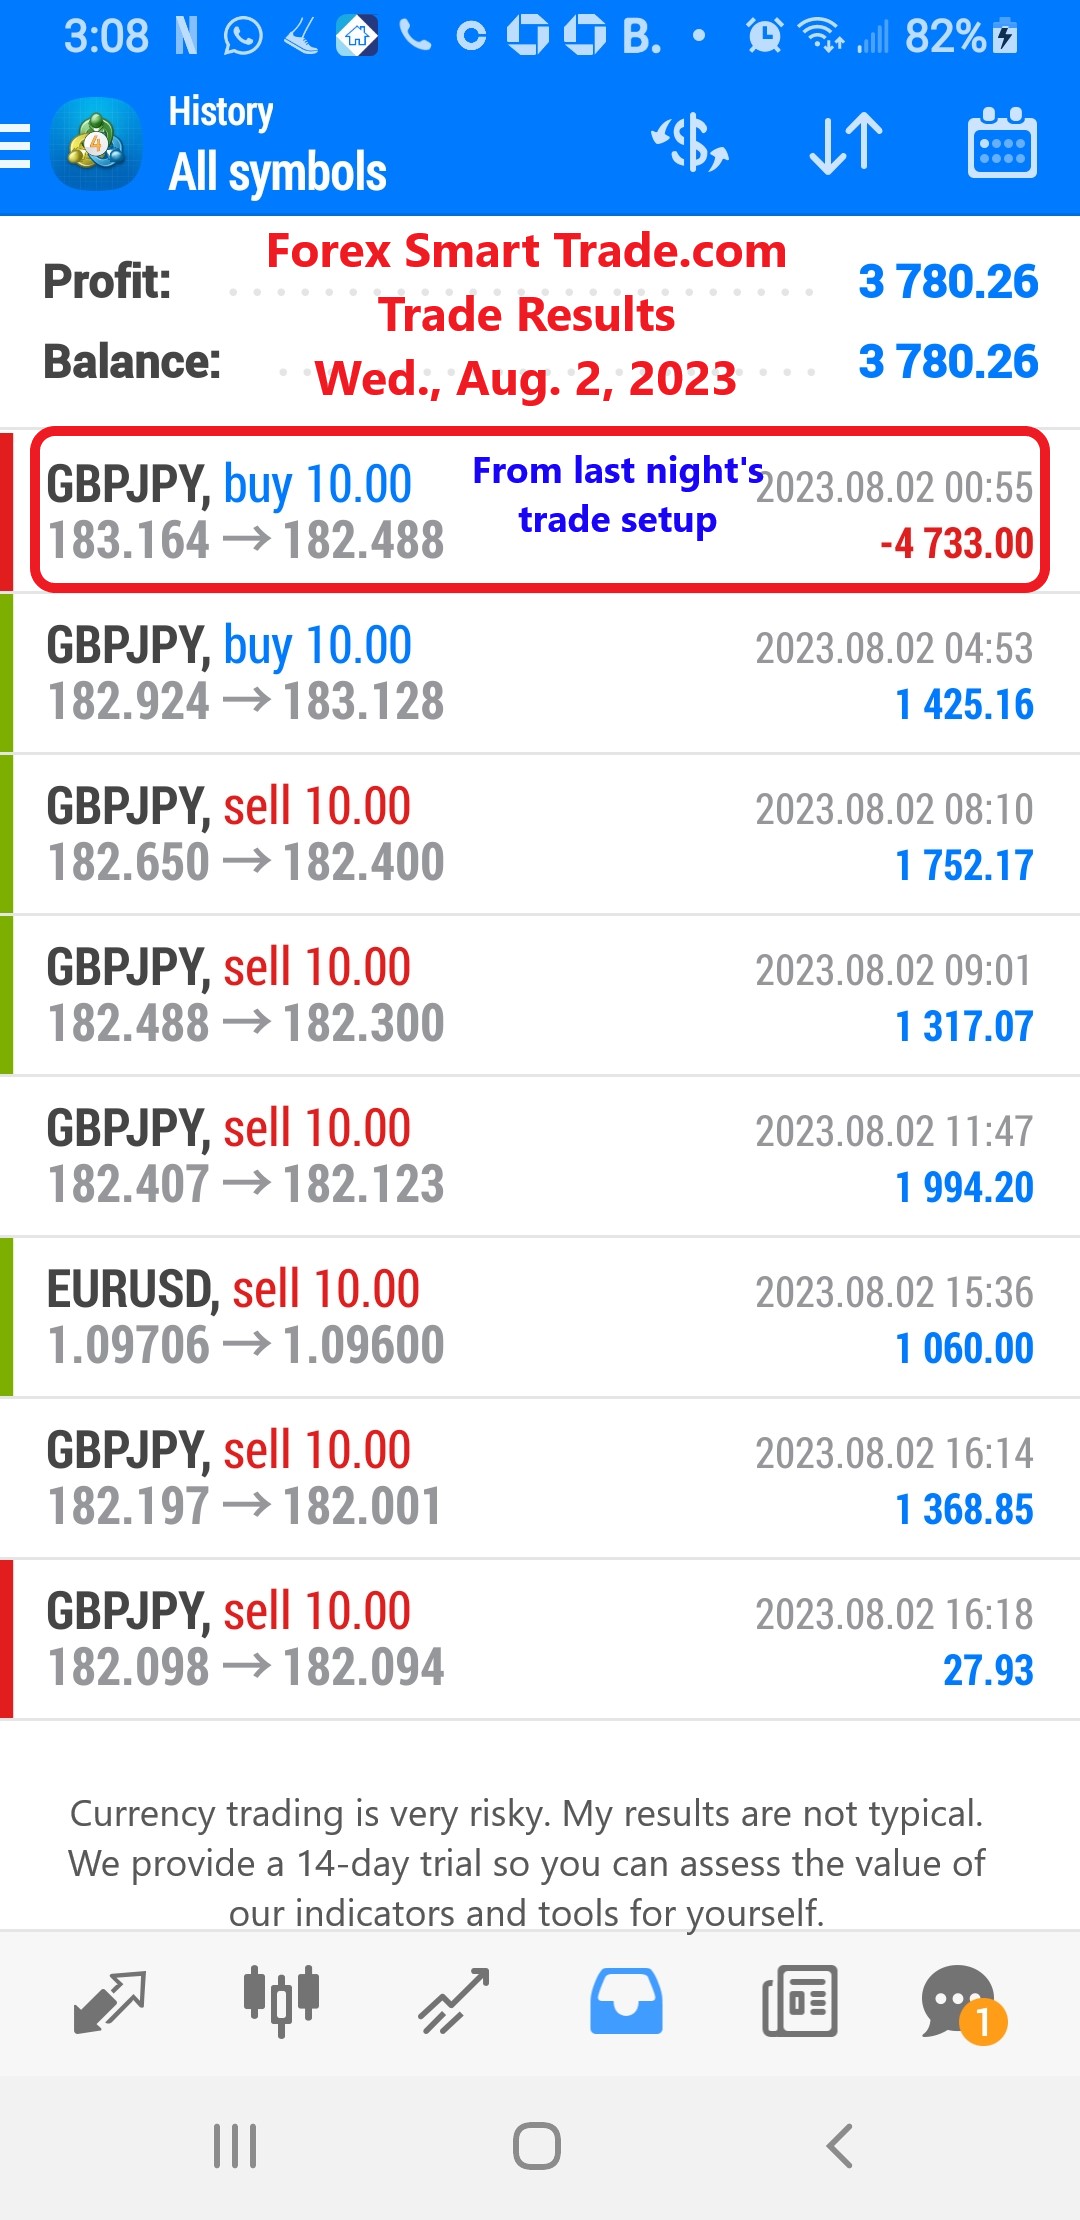
Forex Smart Trade Results, Wednesday, August 2, 2023 – $3,780
Rising Wedge. A rising wedge is formed when the price consolidates between upward-sloping support and resistance lines. Here, the slope of the support line is steeper than […]
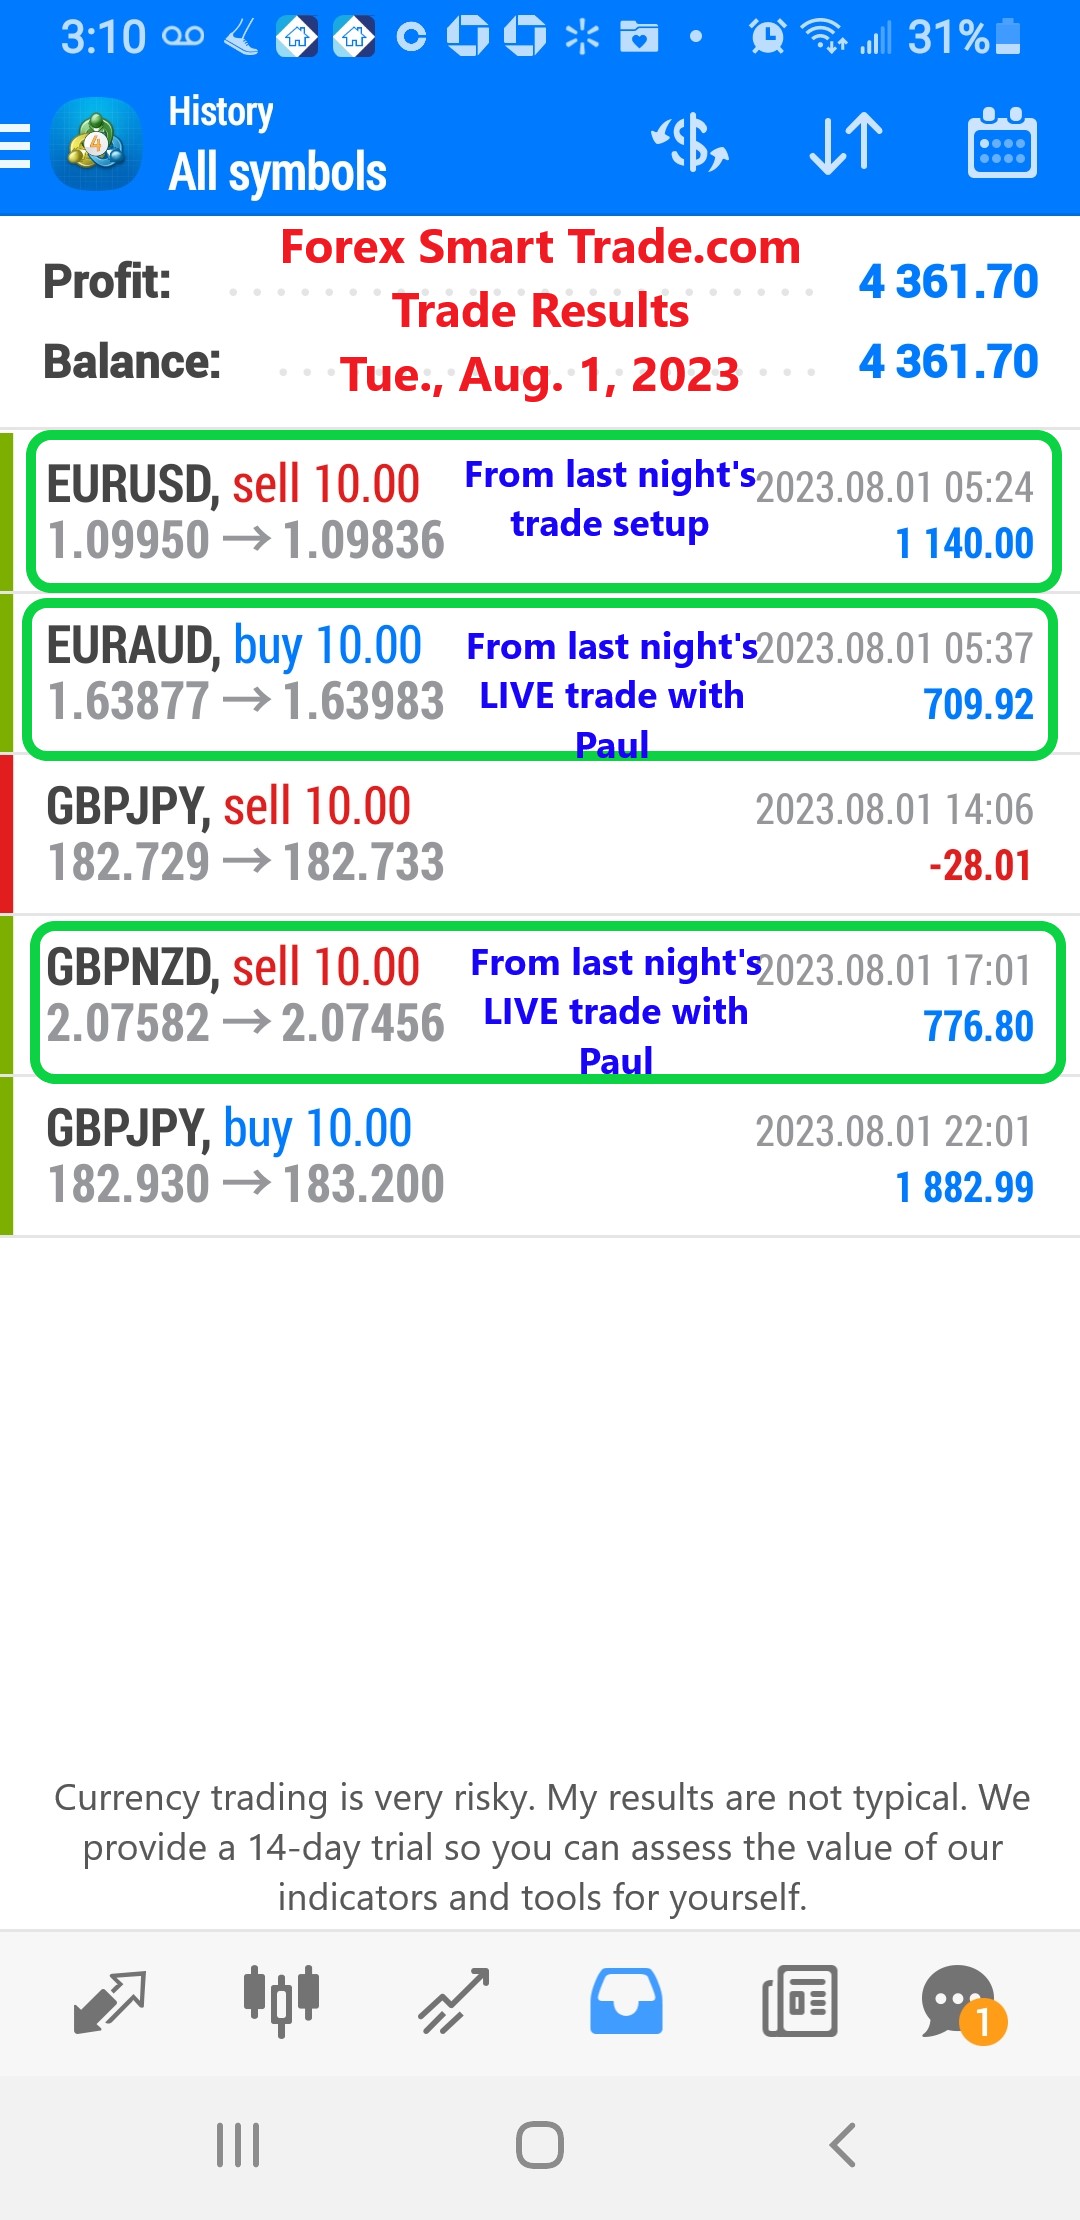
Forex Smart Trade Results, Tuesday, August 1, 2023 – $4,361
How to Trade Wedge Chart Patterns. Let’s take a look at how to trade wedge chart patterns. In a Wedge chart pattern, two trend lines converge. It […]

Forex Smart Trade Results, Monday, July 31, 2023 – $3,190
Inverse Head and Shoulders. Now let’s take a look at an inverse head and shoulders formation. The name speaks for itself. It is a head and […]
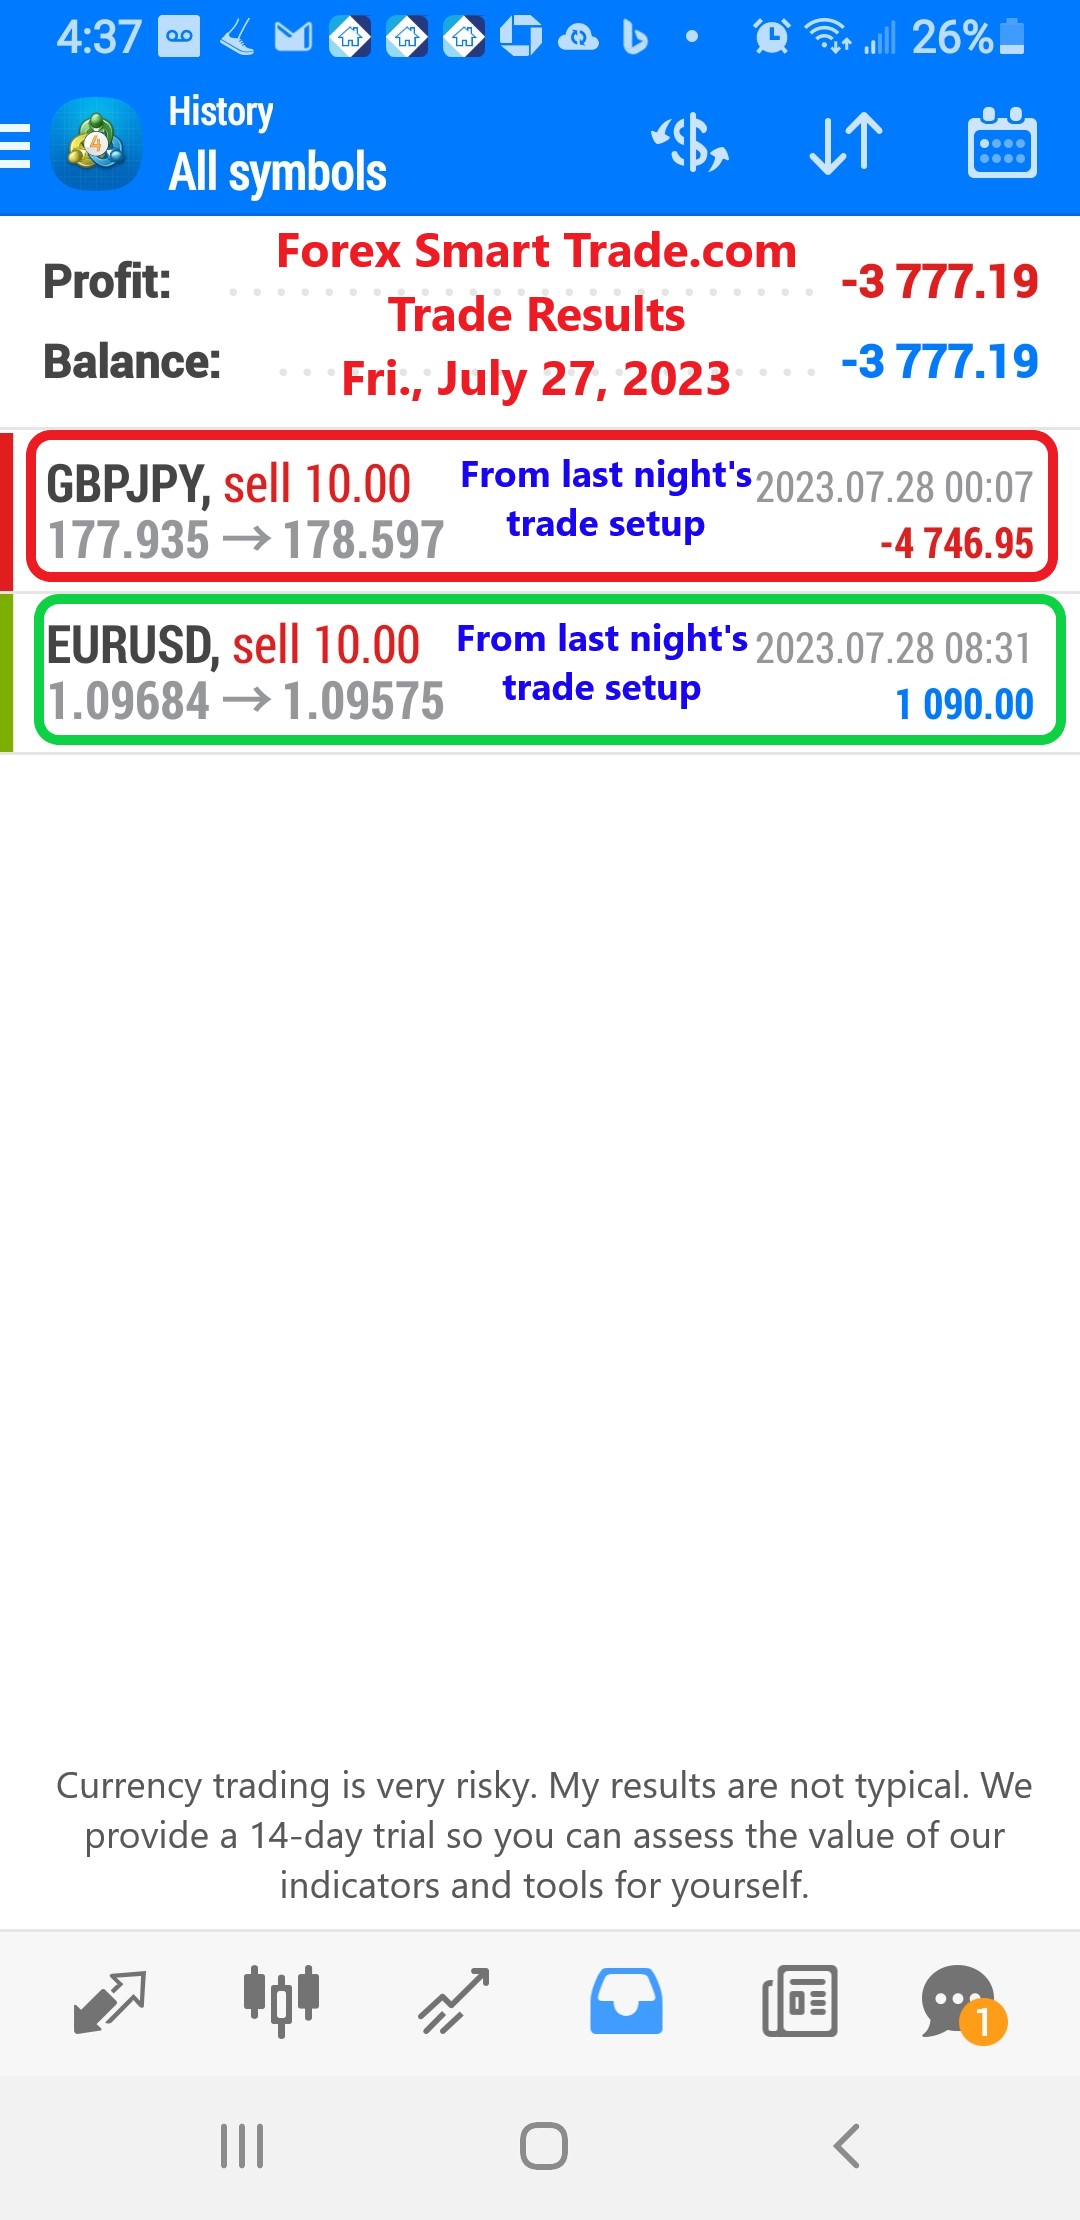
Forex Smart Trade Results, Friday, July 28, 2023 – ($3,777)
How to Trade the Head and Shoulders Pattern. The head and shoulders chart pattern is a reversal pattern and is most often seen in uptrends. Not only […]
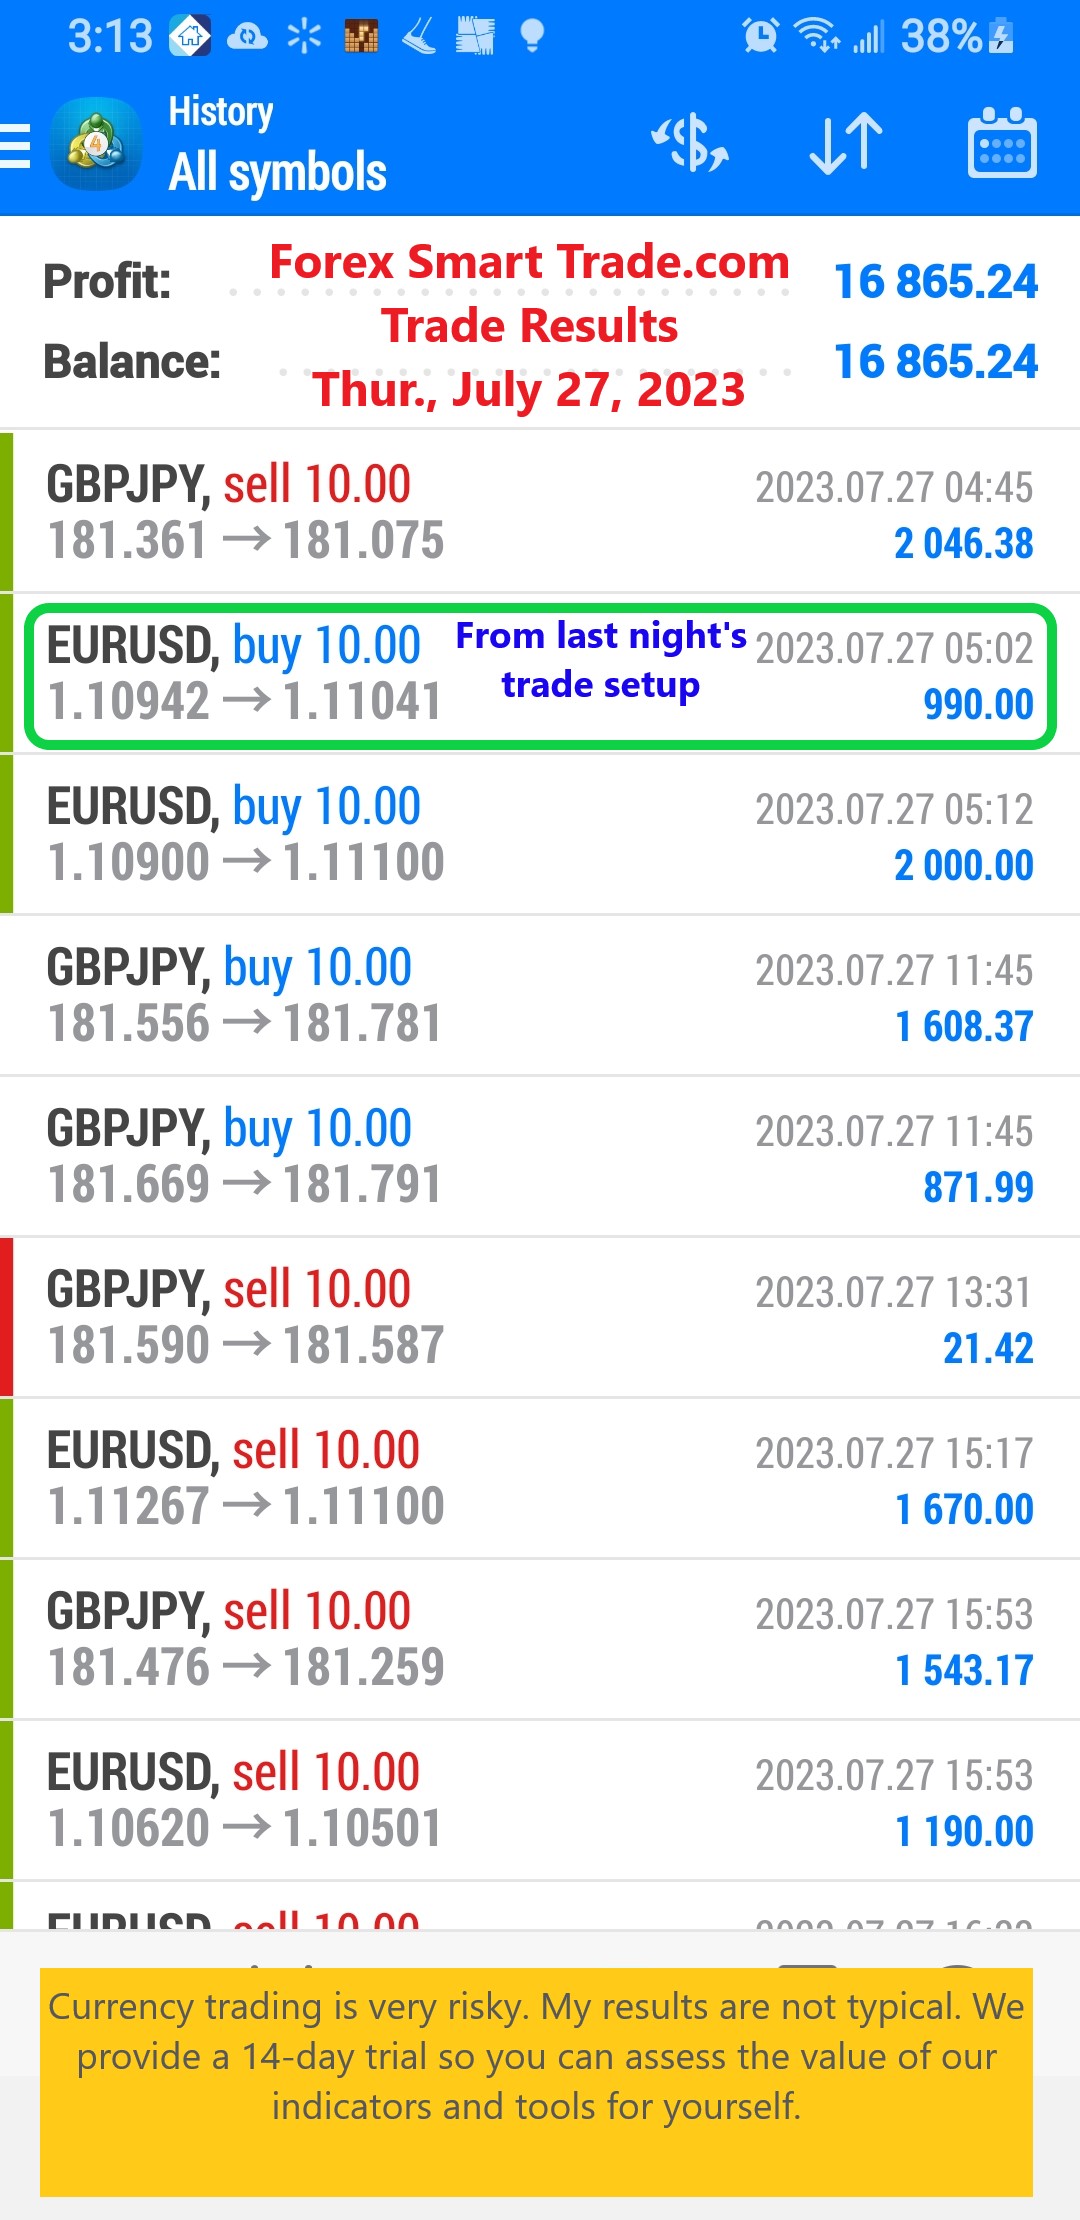
Forex Smart Trade Results, Thursday, July 27, 2023 – $16,865
Double Bottom. The double bottom is also a trend reversal formation, but this time we are looking to go long instead of short. These formations occur after […]
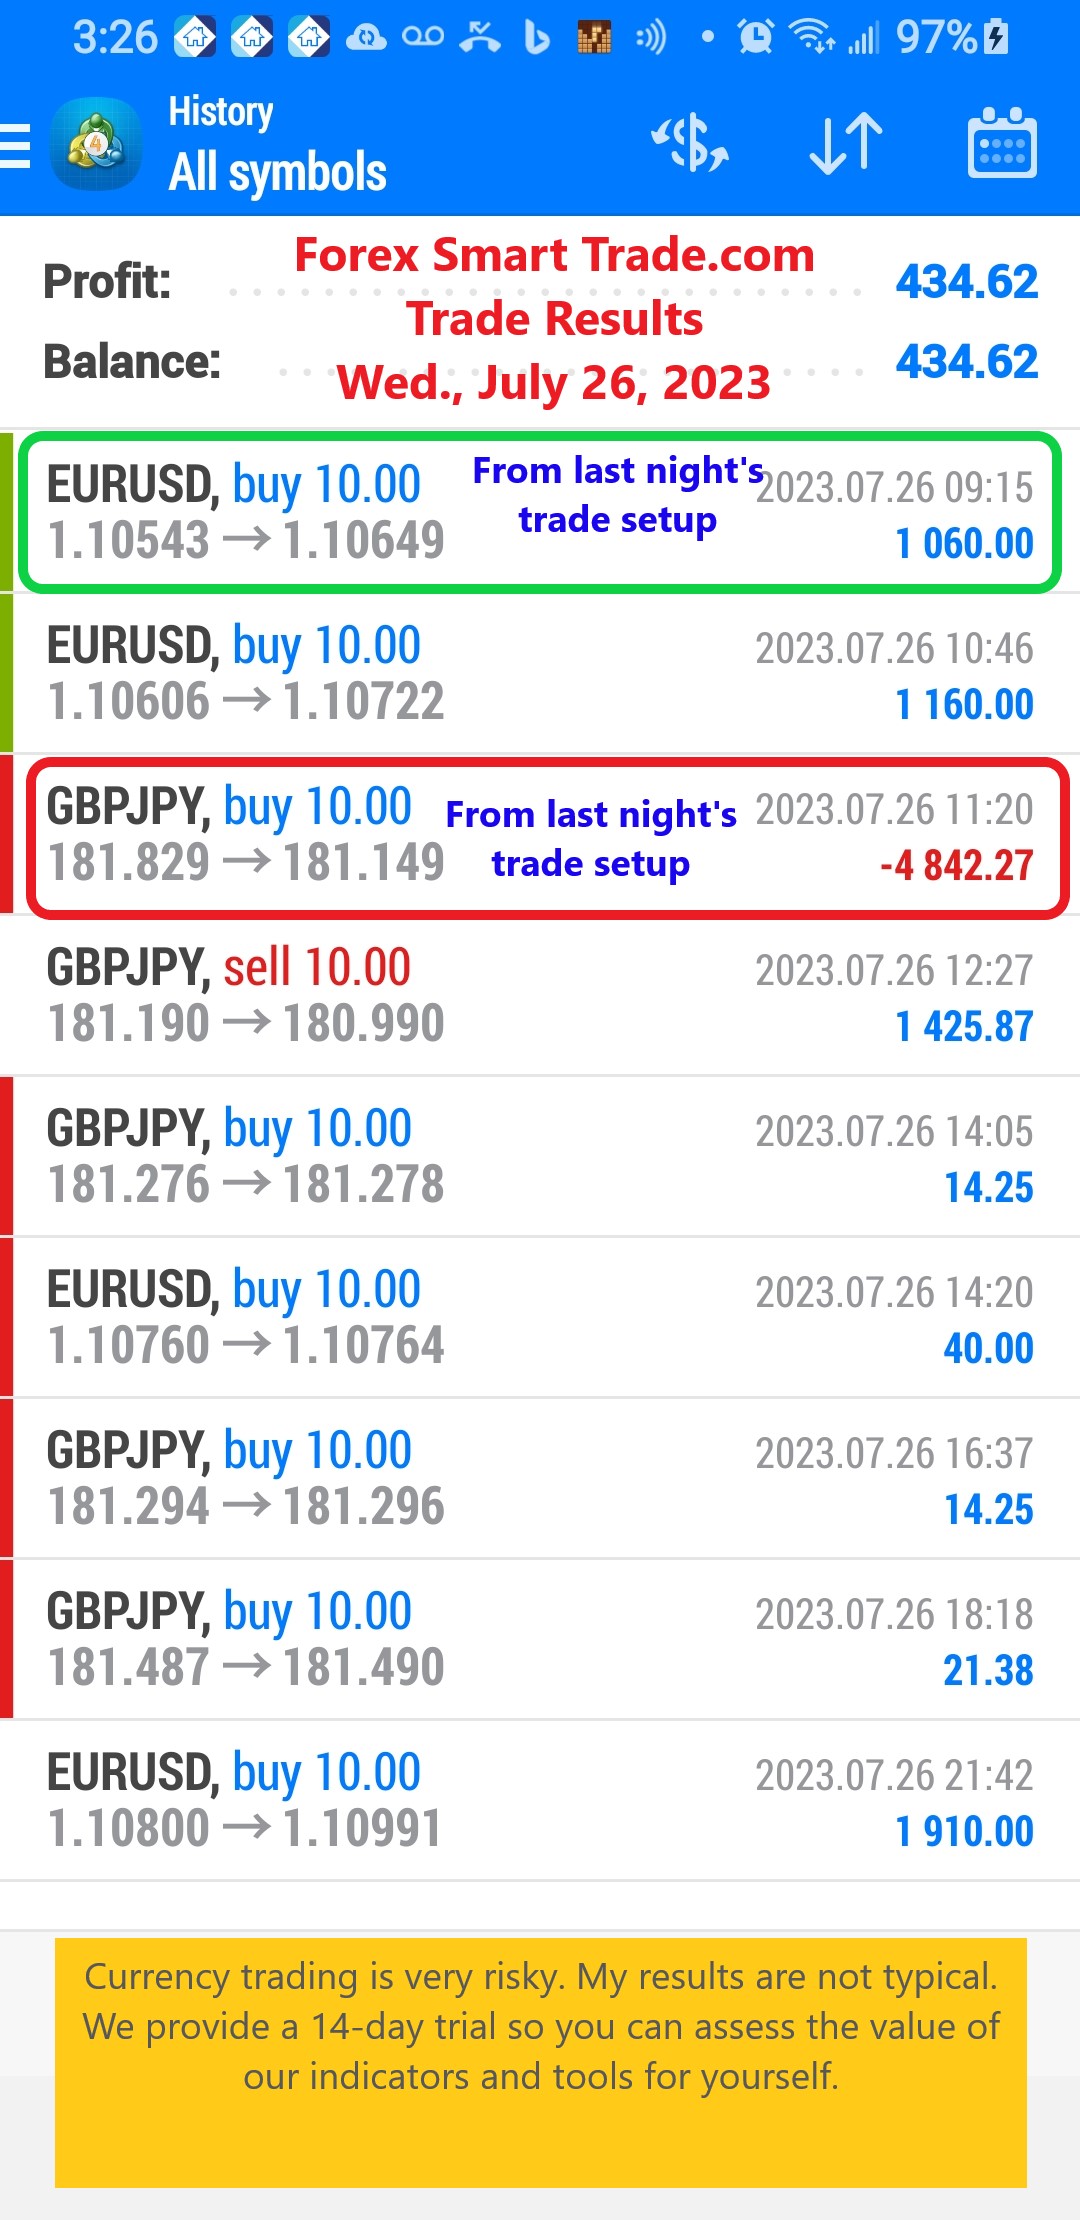
Forex Smart Trade Results, Wednesday, July 26, 2023 – $434
How to Trade Double Tops and Double Bottoms. Continuing our lesson from the last session let’s look at how to trade double tops and double bottoms. […]
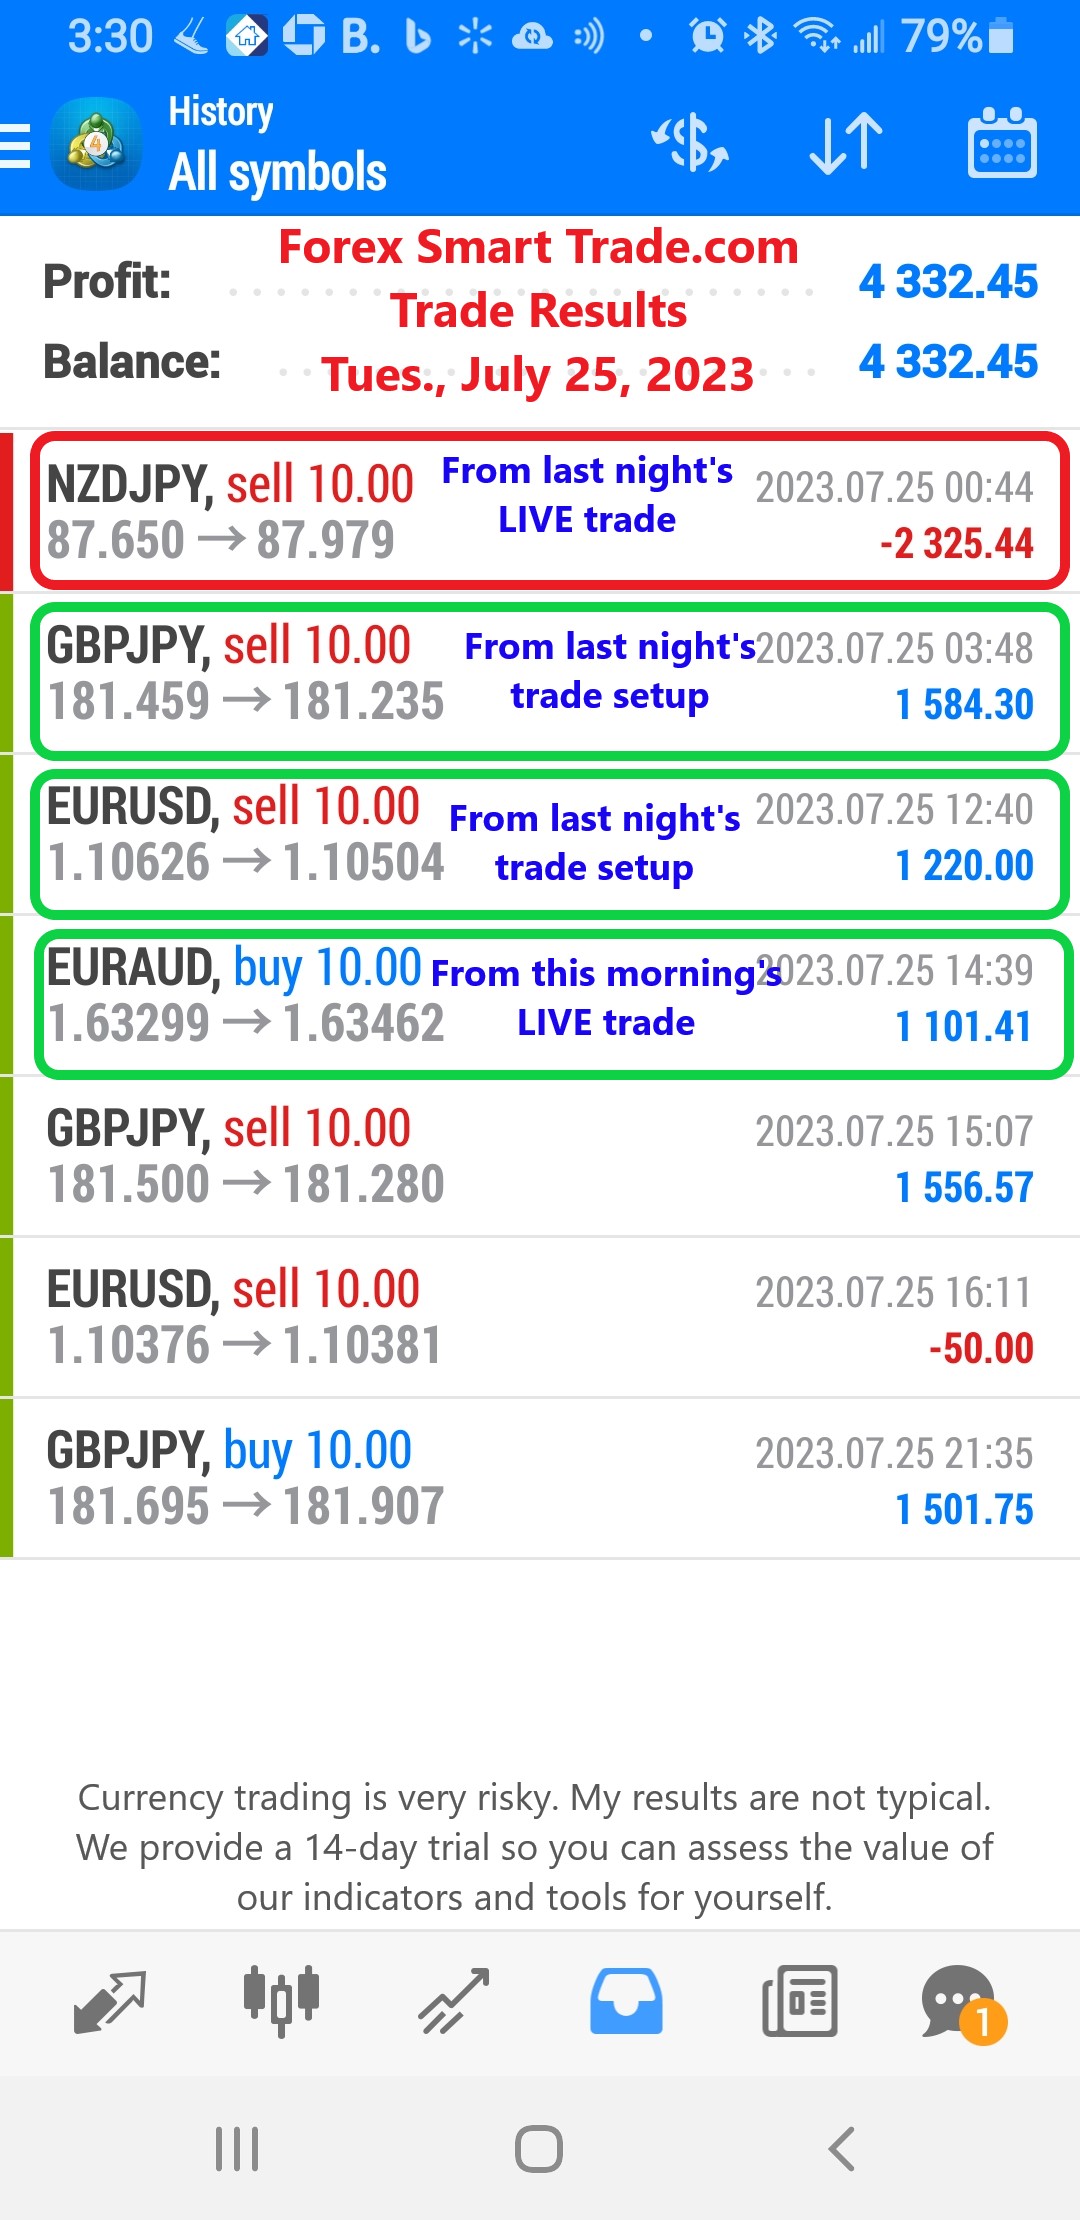
Forex Smart Trade Results, Tuesday, July 25, 2023 – $4,322
How to Trade Chart Patterns. By now you have an arsenal of weapons to use when you battle the market. In this lesson, you will add […]
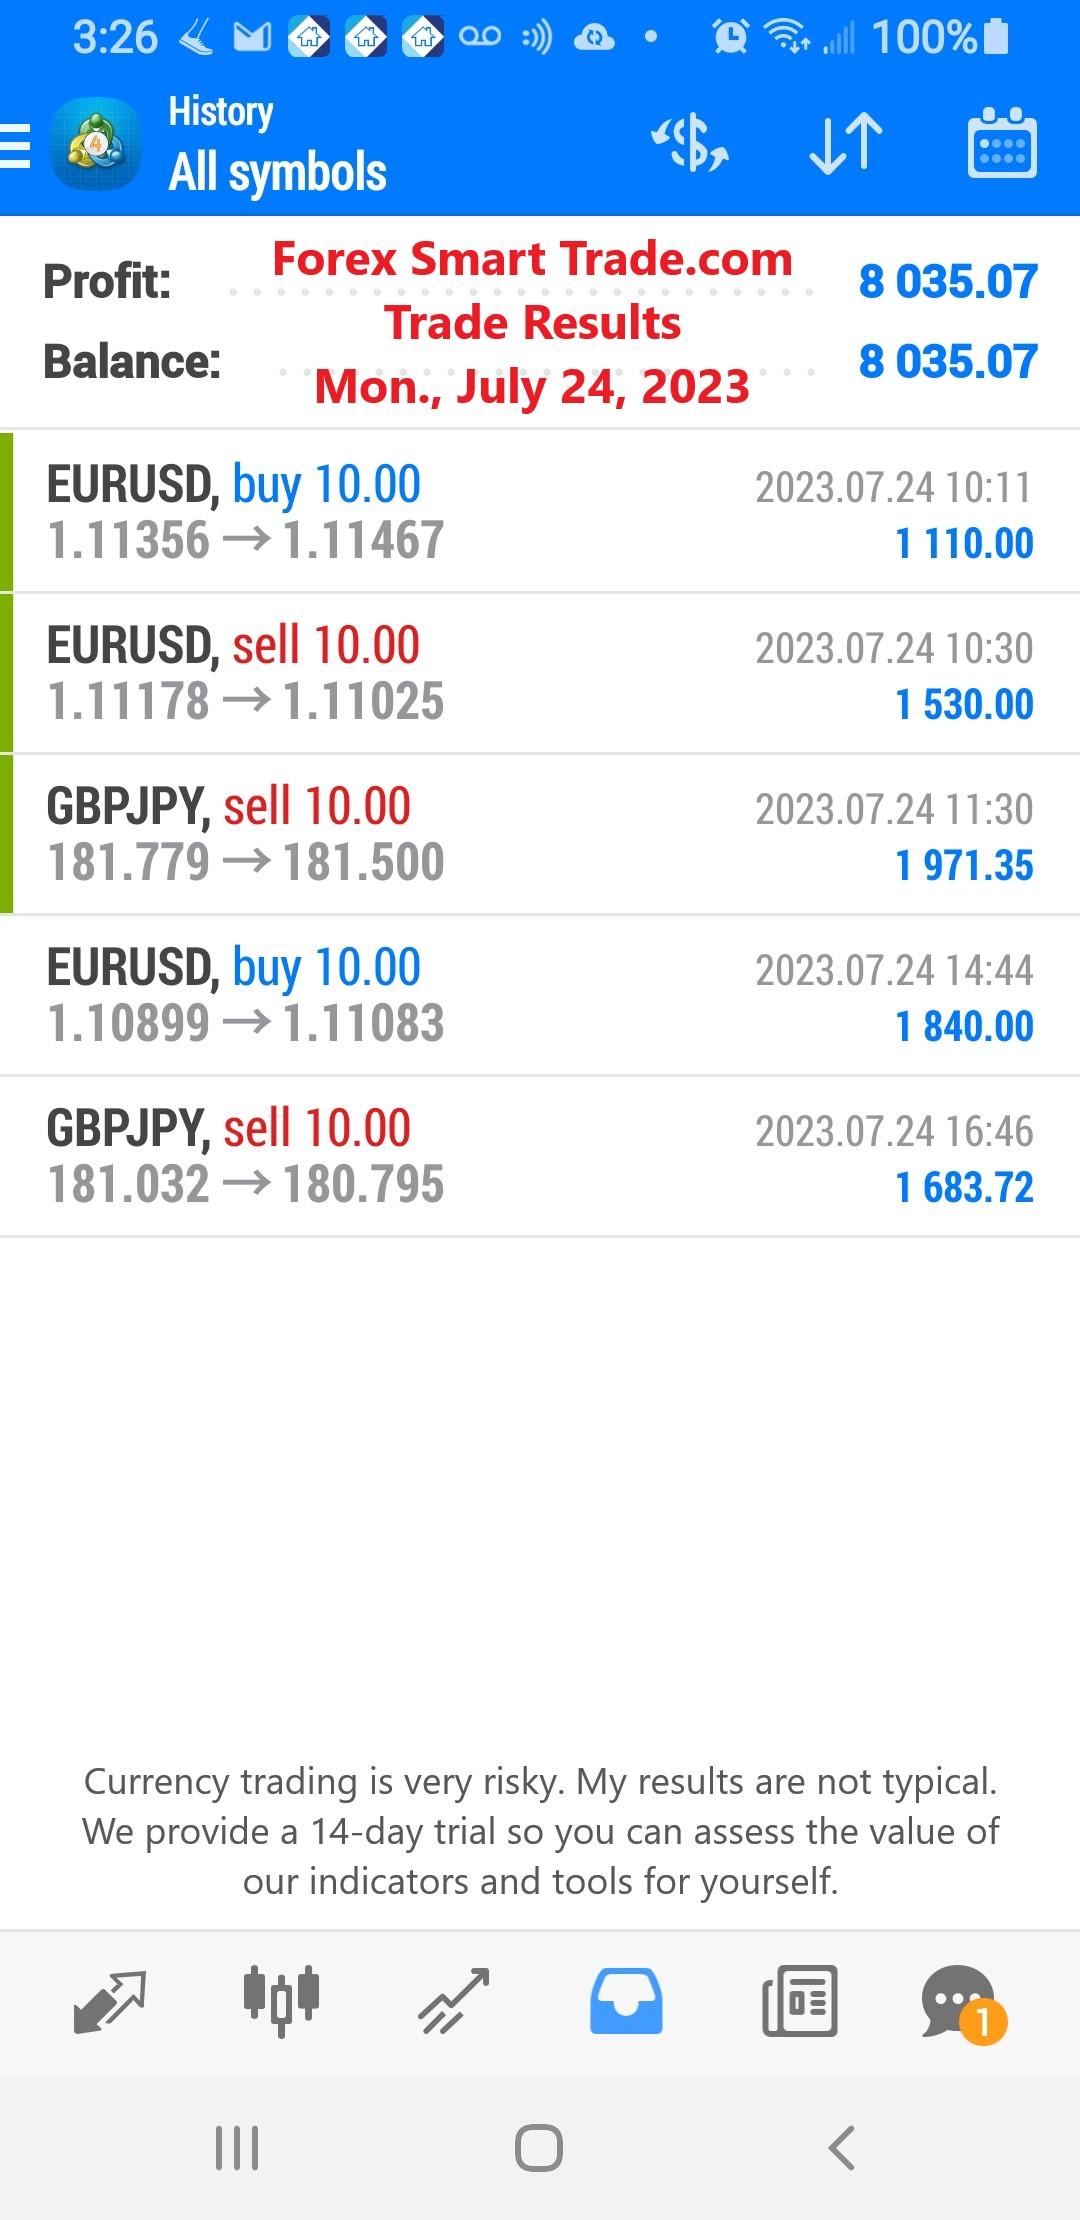
Forex Smart Trade Results, Monday, July 24, 2023 – $8,035
Lagging Indicators. Lagging indicators are also known as trend-following or trend-confirming indicators. Trading signals of the lagging indicators come after the event has occurred on the chart. A disadvantage of lagging […]
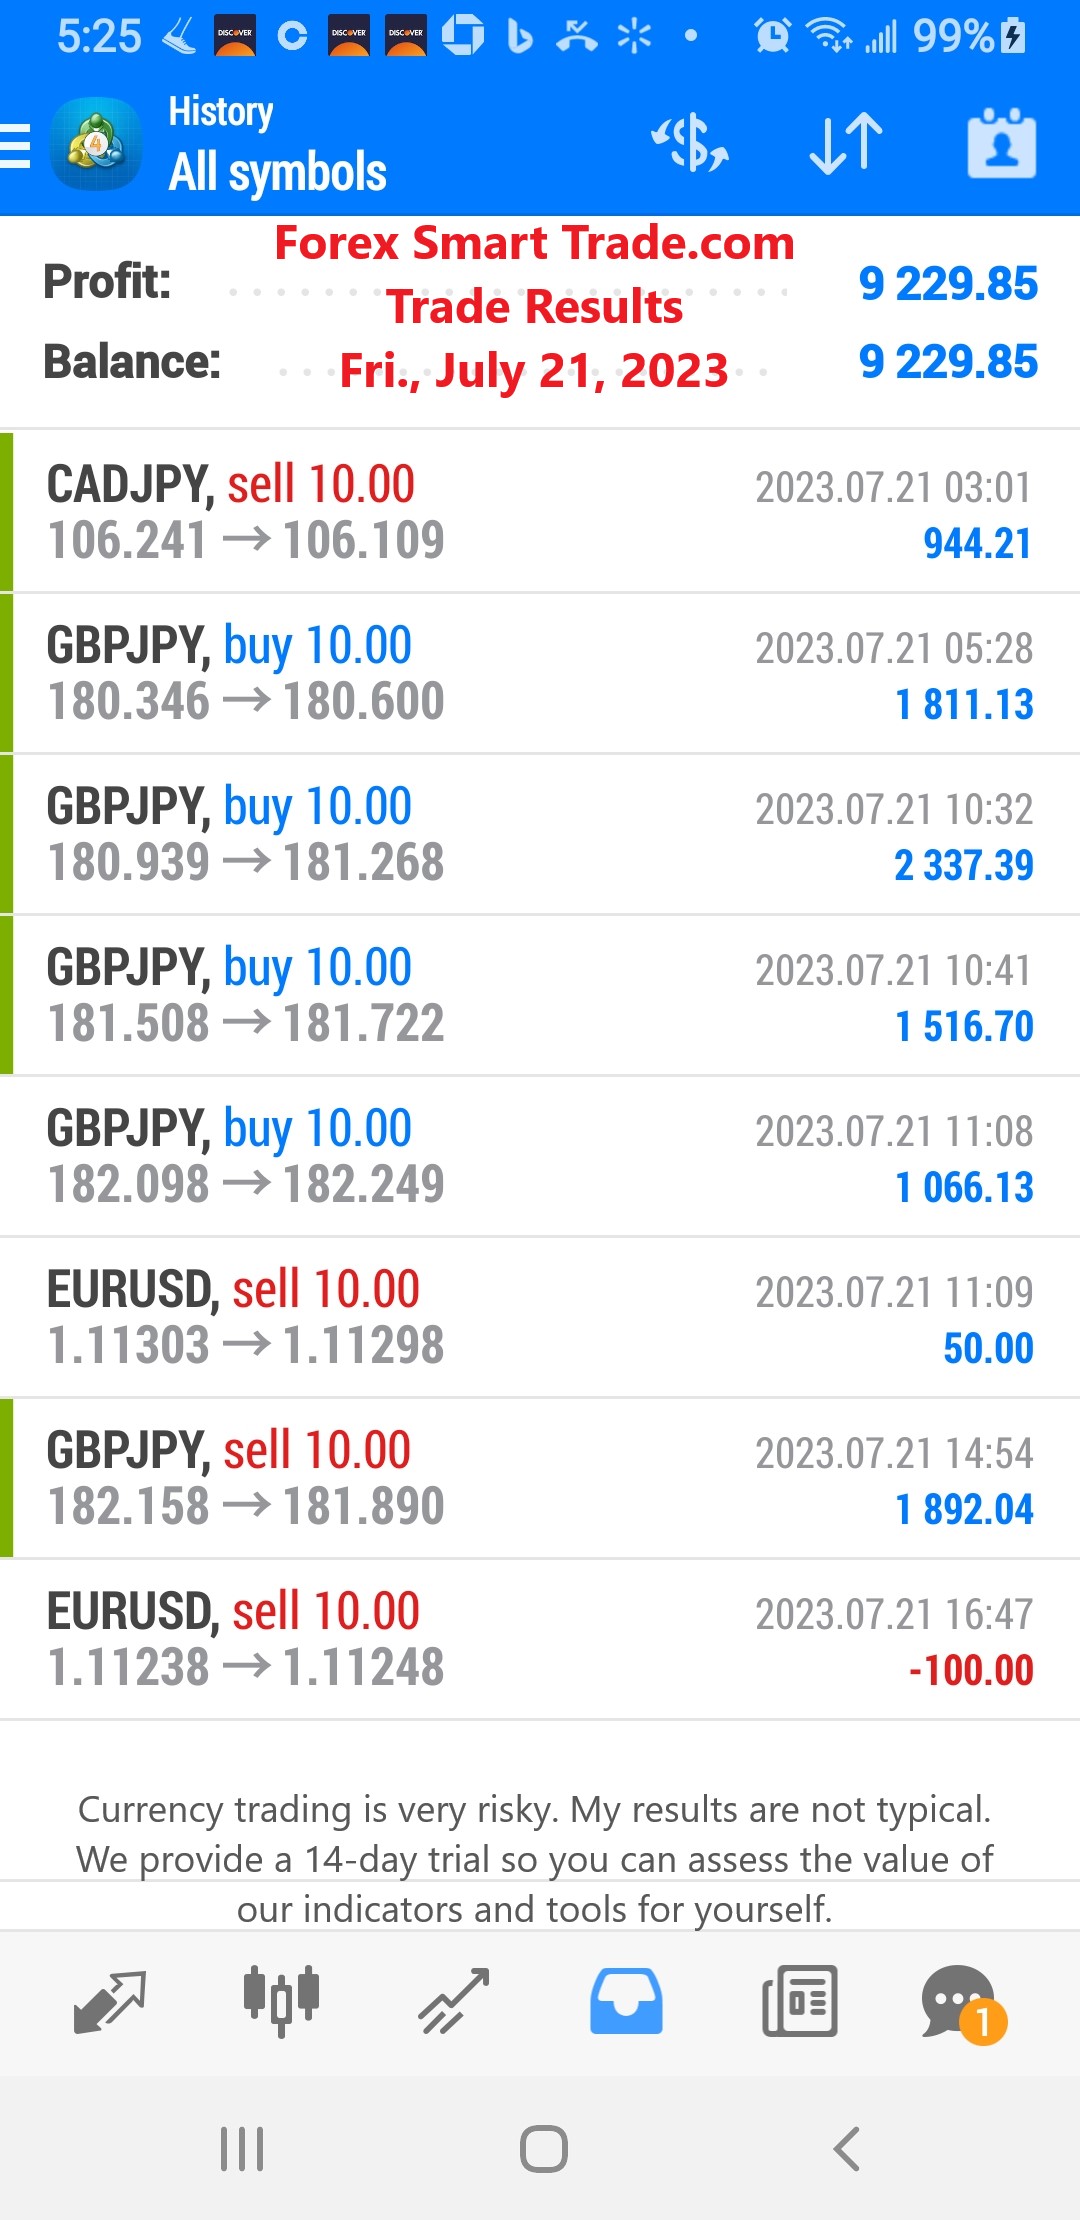
Forex Smart Trade Results, Friday, July 21, 2023 – $9,229
Summary: Leading Indicators. Many forex traders use technical indicators as part of their technical analysis toolbox. We’ve gone through the two types of technical indicators based on the timing of […]

Forex Smart Trade Results, Thursday, July 20, 2023 – $4,256
Confirming a Trend with MACD. Let’s examine confirming a trend with MACD. Let’s look at another chart so you can see how these crossover signals can […]
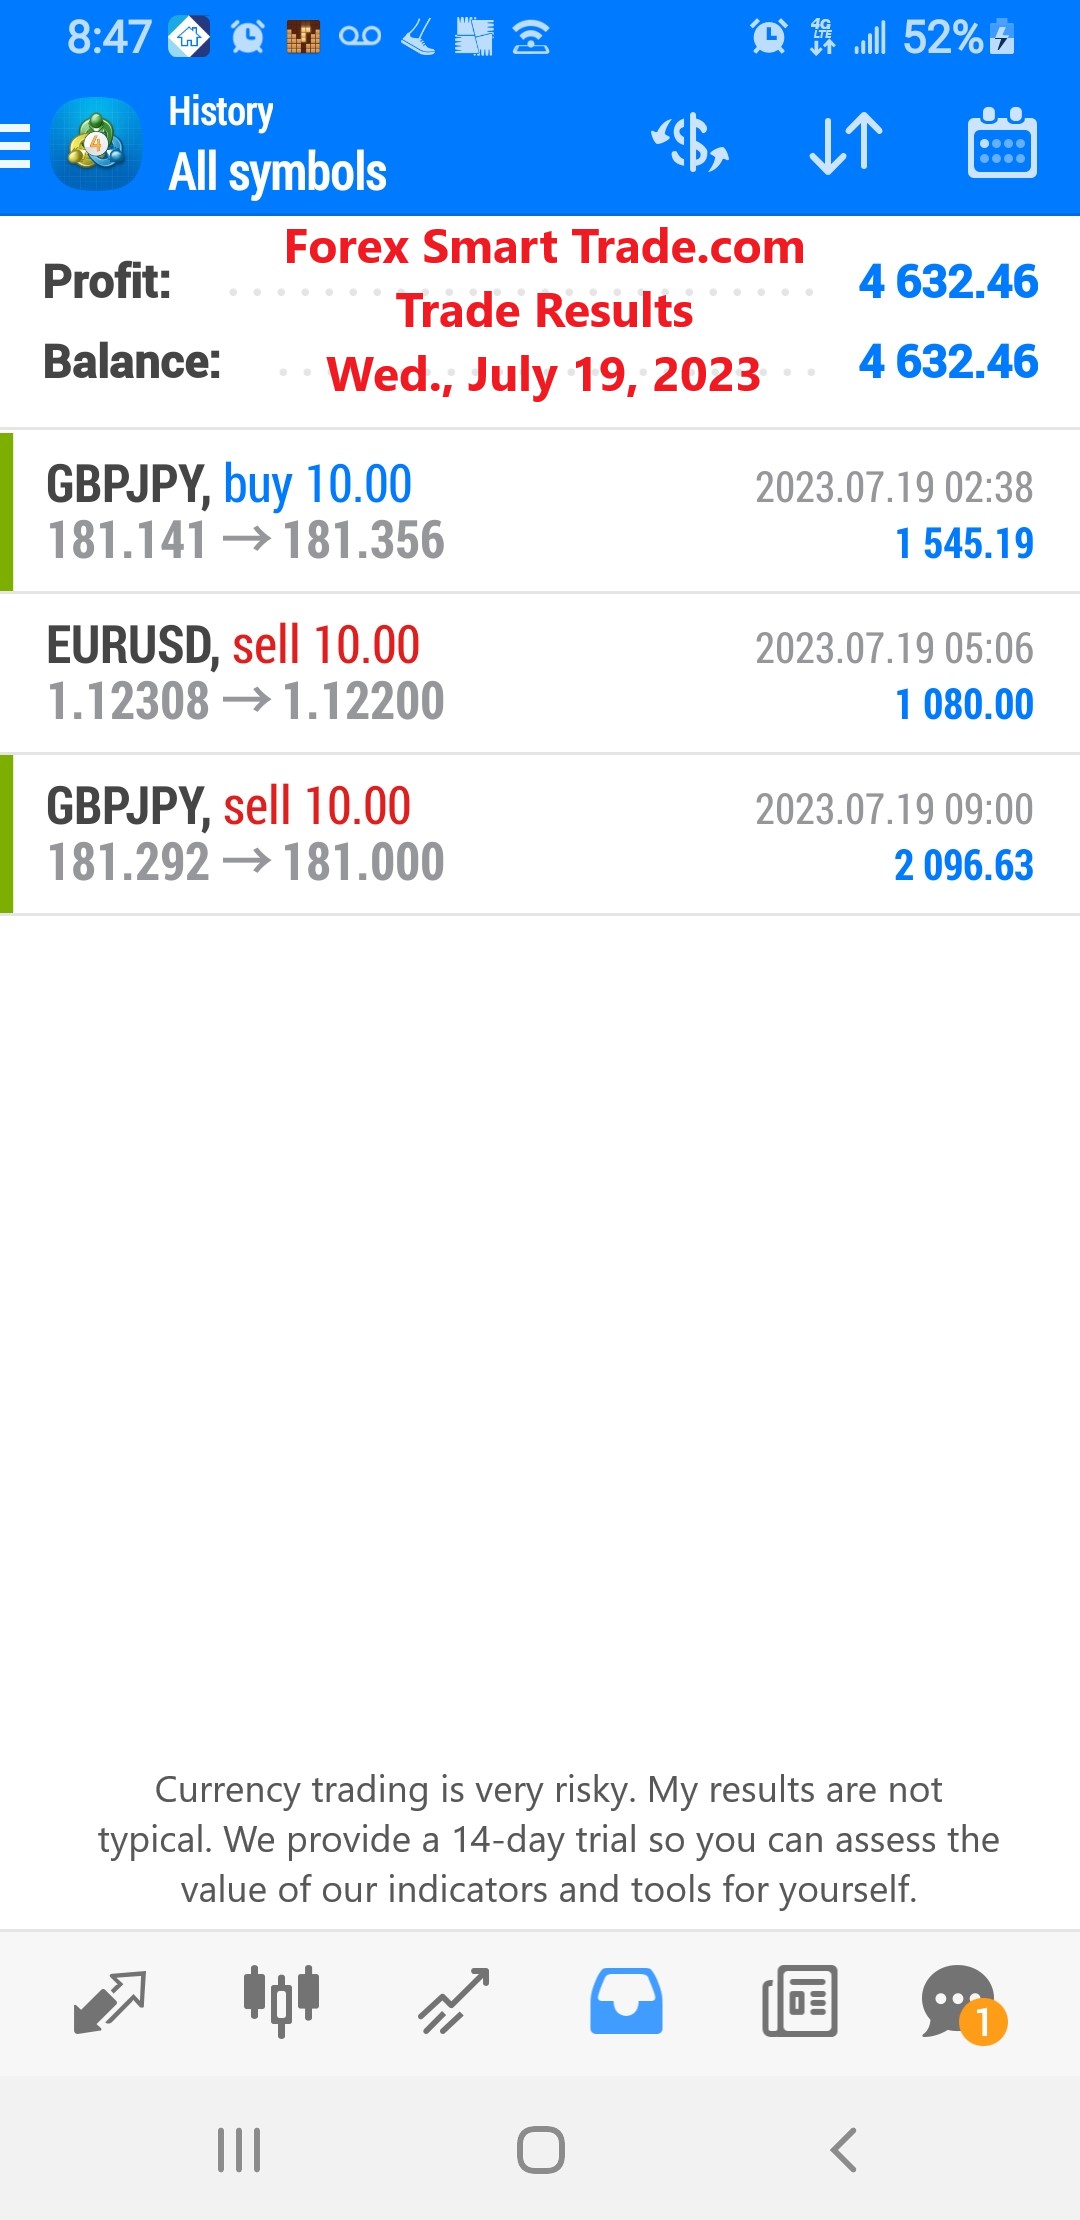
Forex Smart Trade Results, Wednesday, July 19, 2023 – $4,632
How to Use MACD to Confirm a Trend. Let’s see how to use MACD to confirm a trend. Spotting a Trend So how do we spot […]

Forex Smart Trade Results, Tuesday, July 18, 2023 – $5,153
When Oscillators Don’t Work. In our previous example, we saw a situation when oscillators don’t work. What happened to such a good set of indicators? The […]
Forex Smart Trade Results, Monday, July 17, 2023 – $0 – Traveling & Unable to Trade
Trading with Oscillators. Let’s continue our examination of trading with oscillators. Each of these indicators is designed to signal a possible trend reversal, where the previous trend has […]
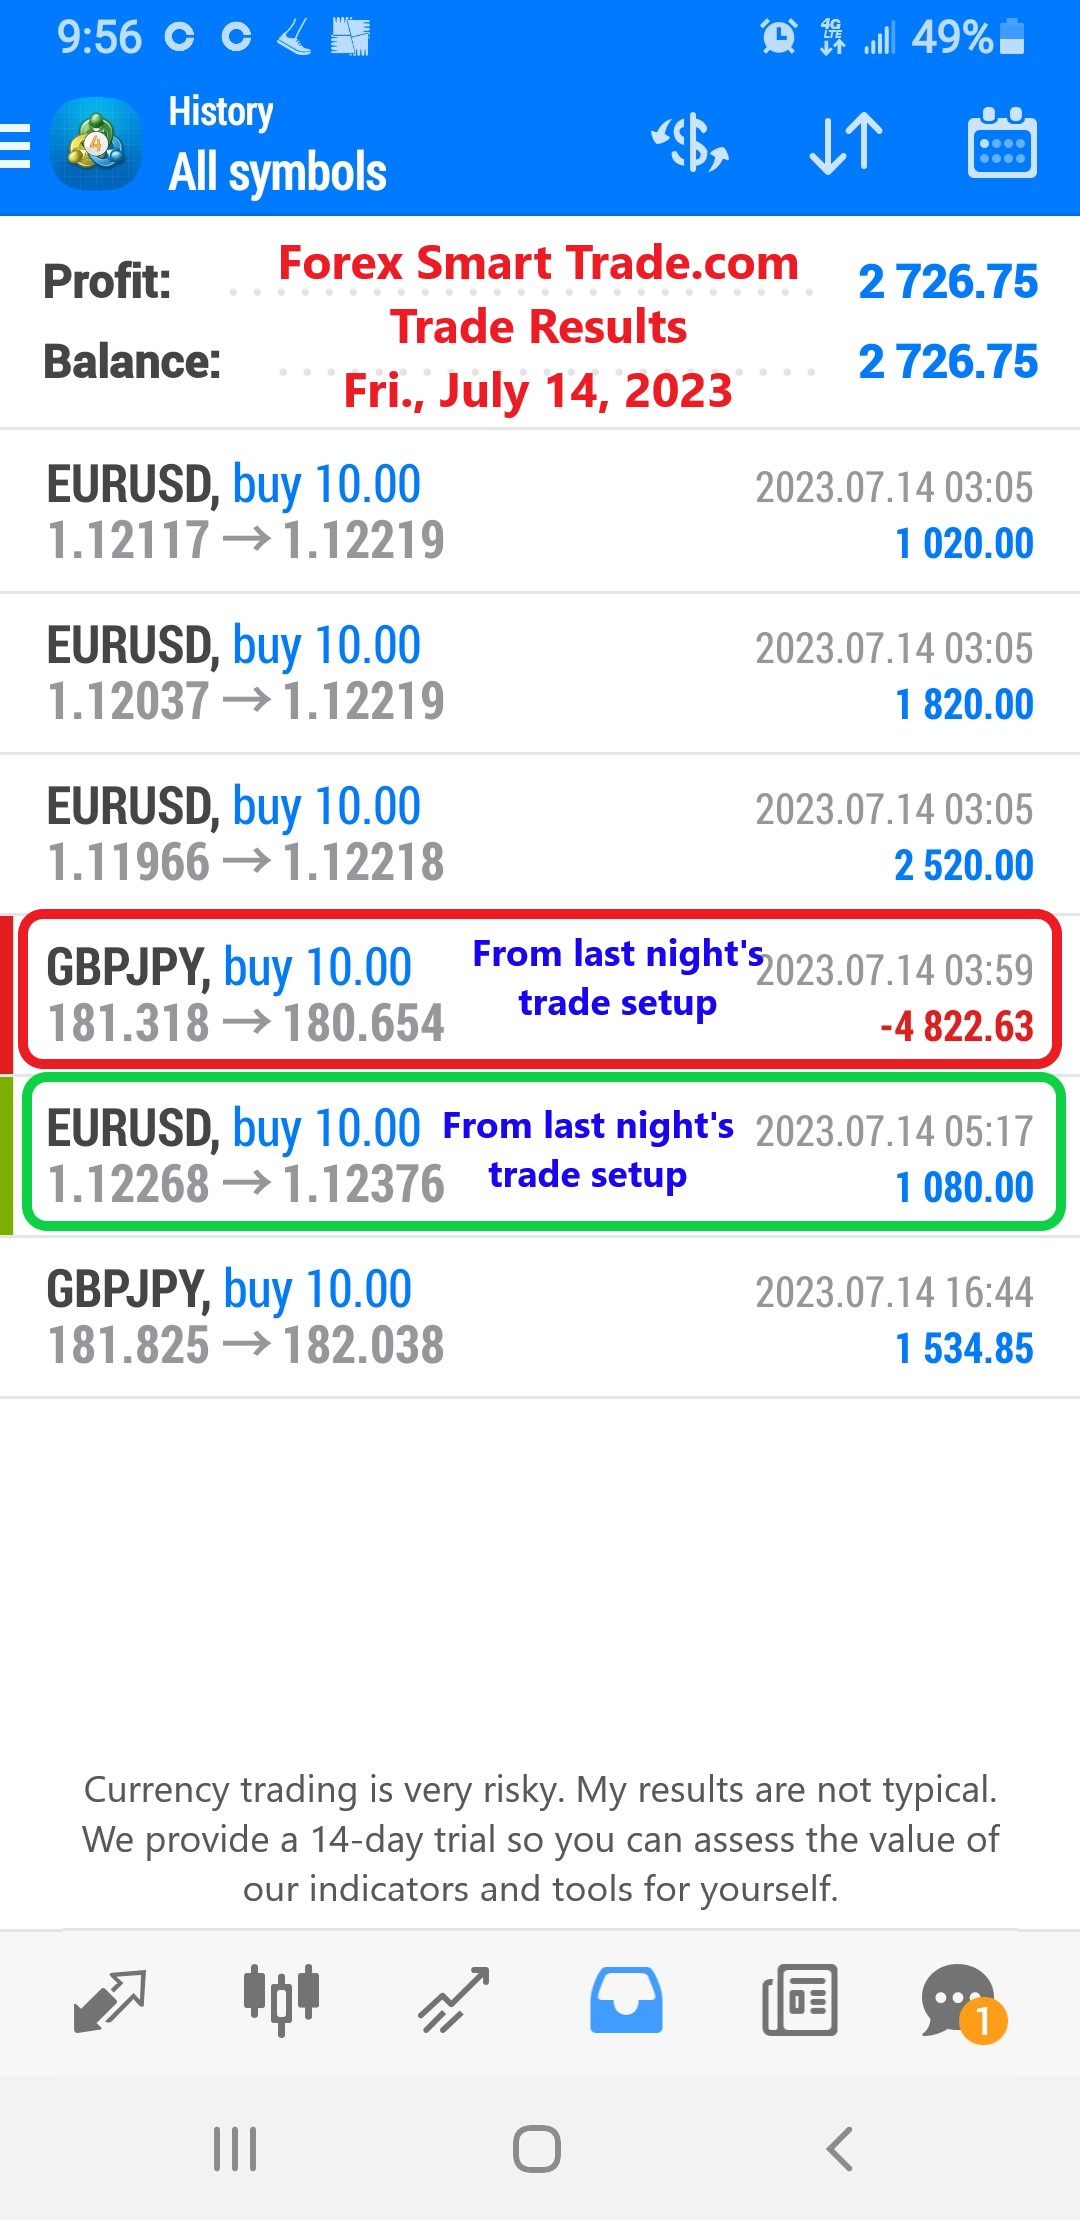
Forex Smart Trade Results, Friday, July 14, 2023 – $2,726
How to Use Oscillators to Warn You of the End of a Trend. Let’s look at how to use oscillators to warn you of the end […]