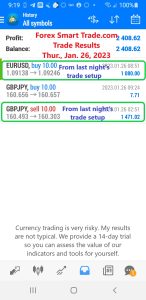
Forex Smart Trade Results, Thursday, January 26, 2023 – $2,408

Forex Smart Trade Results, Wednesday, January 25, 2023 – $2,213
February 11, 2023
Forex Smart Trade Results, Friday, January 27, 2023 – ($641)
February 11, 2023Plotting Support and Resistance Levels.
Let’s take a look at plotting support and resistance levels.
One thing to remember is that support and resistance levels are not exact numbers.
Often times you will see a support or resistance level that appears broken, but soon after find out that the market was just testing it.
With candlestick charts, these “tests” of support and resistance are usually represented by the candlestick shadows.
Notice how the shadows of the candles tested the 1.4700 support level.
At those times it seemed like the price was “breaking” support.
In hindsight, we can see that the price was merely testing that level.

Learn to Day Trade Forex
If you’d like to earn extra income trading on the Forex market, consider learning how to currency trade with Forex Smart Trade. With their super-accurate proprietary trading tools and best-in-the-business, personalized one-on-one training, you’ll be successful. Check out the Forex Smart Trade webinar. It shows one of their trader’s trading and how easy, intuitive, and accurate the tools are. Or try the Forex Smart Trade 14-day introductory trial for just TEN dollars.


