Forex Smart Trade Results, Friday, January 27, 2023 – ($641)

Forex Smart Trade Results, Thursday, January 26, 2023 – $2,408
February 11, 2023
Forex Smart Trade Results, Monday, January 30, 2023 – $3,249
February 13, 2023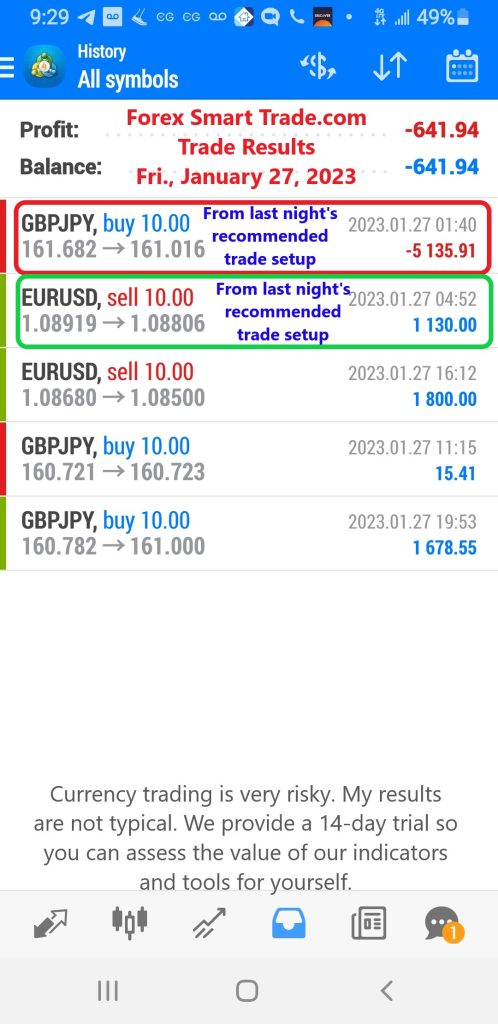
Breaking Support and Resistance.
So how do we truly know if support and resistance were broken?
There is no definite answer to this question.
Some argue that a support or resistance level is broken if the price can actually close past that level.
However, you will find that this is not always the case.
Let’s take the same example from the previous section.
And see what happened when the price actually closed past the 1.4700 support level.

In this case, the price had closed below the 1.4700 support level.
But the price ended up rising back up above it.
If you had believed that this was a real breakout and sold this pair, you would’ve been seriously hurtin’!
Looking at the chart now, you can visually see and come to the conclusion that the support was not actually broken.
It is still very much intact and now even stronger.
Support was “breached” but only temporarily.
To help you filter out these false breakouts, you should think of support and resistance more as “zones” rather than concrete numbers.
One way to help you find these zones is to plot support and resistance on a line chart rather than a candlestick chart.
The reason is that line charts only show you the closing price while candlesticks add extreme highs and lows to the picture.
These highs and lows can be misleading because oftentimes they are just the “knee-jerk” reactions of the market.
It’s like when someone is doing something really strange, but when asked about it, he or she simply replies, “Sorry, it’s just a reflex.”
When plotting support and resistance, you don’t want the reflexes of the market. You only want to plot its intentional movements.
Looking at the line chart, you want to plot your support and resistance lines around areas where you can see the price forming several peaks or valleys.


Learn to Day Trade Forex
If you’d like to earn extra income trading on the Forex market, consider learning how to currency trade with Forex Smart Trade. With their super-accurate proprietary trading tools and best-in-the-business, personalized one-on-one training, you’ll be successful. Check out the Forex Smart Trade webinar. It shows one of their trader’s trading and how easy, intuitive, and accurate the tools are. Or try the Forex Smart Trade 14-day introductory trial for just TEN dollars.