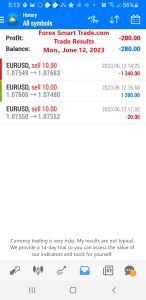
Forex Smart Trade Results, Monday, June 12, 2023 – ($280)

Forex Smart Trade Results, Friday, June 9, 2023 – $9,867
June 17, 2023
Forex Smart Trade Results, Tuesday, June 13, 2023 – $11,055
June 21, 2023
How to Trade Using MACD.
Let’s take a look at how to trade using MACD.
Because there are two moving averages with different “speeds”, the faster one will obviously be quicker to react to price movement than the slower one.
When a new trend occurs, the faster line (MACD Line) will react first and eventually cross the slower line (Signal Line).
When this “crossover” occurs, and the fast line starts to “diverge” or move away from the slower line, it often indicates that a new trend has formed.

From the chart above, you can see that the fast line crossed UNDER the slow line and correctly identified a new downtrend.
Notice that when the lines are crossed, the Histogram temporarily disappears.
This is because the difference between the lines at the time of the cross is 0.
As the downtrend begins and the fast line diverges away from the slow line, the histogram gets bigger, which is a good indication of a strong trend.
Example
Let’s take a look at an example.

In EUR/USD’s 1-hour chart above, the fast line crossed above the slow line while the histogram disappeared. This suggested that the brief downtrend could potentially reverse.
From then, EUR/USD began shooting up as it started a new uptrend. Imagine if you went long after the crossover, you would’ve gained almost 200 pips!
There is one drawback to MACD.
Naturally, moving averages tend to LAG behind price.
After all, it’s just an average of historical prices.
Remember, the MACD indicator consists of three components:
- The MACD Line represents the difference between two moving averages.
- The Signal Line is a moving average of the MACD Line.
- The Histogram is a graphical representation of the distance between the MACD Line and the Signal Line.
Learn to Day Trade Forex
If you’d like to earn extra income trading on the Forex market, consider learning how to currency trade with Forex Smart Trade. With their super-accurate proprietary trading tools and best-in-the-business, personalized one-on-one training, you’ll be successful. Check out the Forex Smart Trade webinar. It shows one of their trader’s trading and how easy, intuitive, and accurate the tools are. Or try the Forex Smart Trade 14-day introductory trial for just TEN dollars.