Forex Smart Trade Results, Monday, January 23, 2023 – $3,886

Forex Smart Trade Results, Friday, January 20, 2023 – $4,892
February 4, 2023
Forex Smart Trade Results, Tuesday, January 24, 2023 – $1,331
February 11, 2023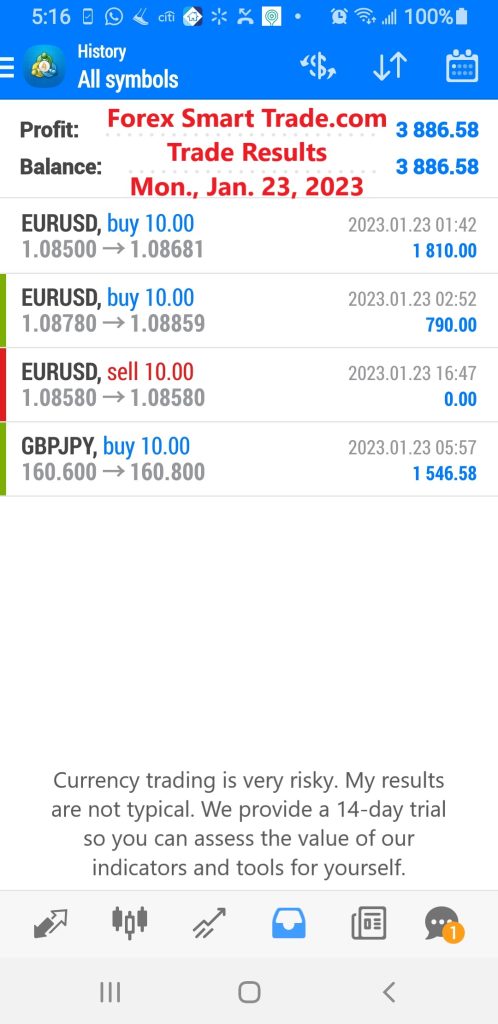
Bar Chart.
A bar chart is a little more complex.
It shows the opening and closing prices, as well as the highs and lows.
Bar charts help a trader see the price range of each period.

Bars may increase or decrease in size from one bar to the next, or over a range of bars.
The bottom of the vertical bar shows the lowest traded price for that time period, while the top of the bar shows the highest price paid.
The vertical bar itself shows the currency pair’s trading range.
As the price fluctuations become increasingly volatile, the bars become larger. As the price fluctuations become quieter, the bars become smaller.
The fluctuation in bar size is because of the way we construct each bar. The vertical height of the bar reflects the range between the high and the low price of the bar period.
The price bar also records the period’s opening and closing prices with attached horizontal lines.
The horizontal hash on the left side of the bar is the opening price, and the horizontal hash on the right side is the closing price.
Bar Chart Example
Here is an example of a bar chart for EUR/USD:

Take note, throughout our lessons, you will see the word “bar” regarding a single piece of data on a chart.
A bar is simply one segment of time, whether it is one day, one week, or one hour.
When you see the word ‘bar’ going forward, be sure to understand what time frame it is referencing.
Bar charts are also called “OHLC” charts because they indicate the Open, the High, the Low, and the Close for that currency pair.
A big difference between a line chart and an OHLC (open, high, low, and close) chart is that the OHLC chart can show volatility.
Example of a Price Bar
Here’s an example of a price bar again:
Open: The little horizontal line on the left is the opening price
High: The top of the vertical line defines the highest price of the time period
Low: The bottom of the vertical line defines the lowest price of the time period
Close: The little horizontal line on the right is the closing price
Learn to Day Trade Forex
If you’d like to earn extra income trading on the Forex market, consider learning how to currency trade with Forex Smart Trade. With their super-accurate proprietary trading tools and best-in-the-business, personalized one-on-one training, you’ll be successful. Check out the Forex Smart Trade webinar. It shows one of their trader’s trading and how easy, intuitive, and accurate the tools are. Or try the Forex Smart Trade 14-day introductory trial for just TEN dollars.