Trade Results
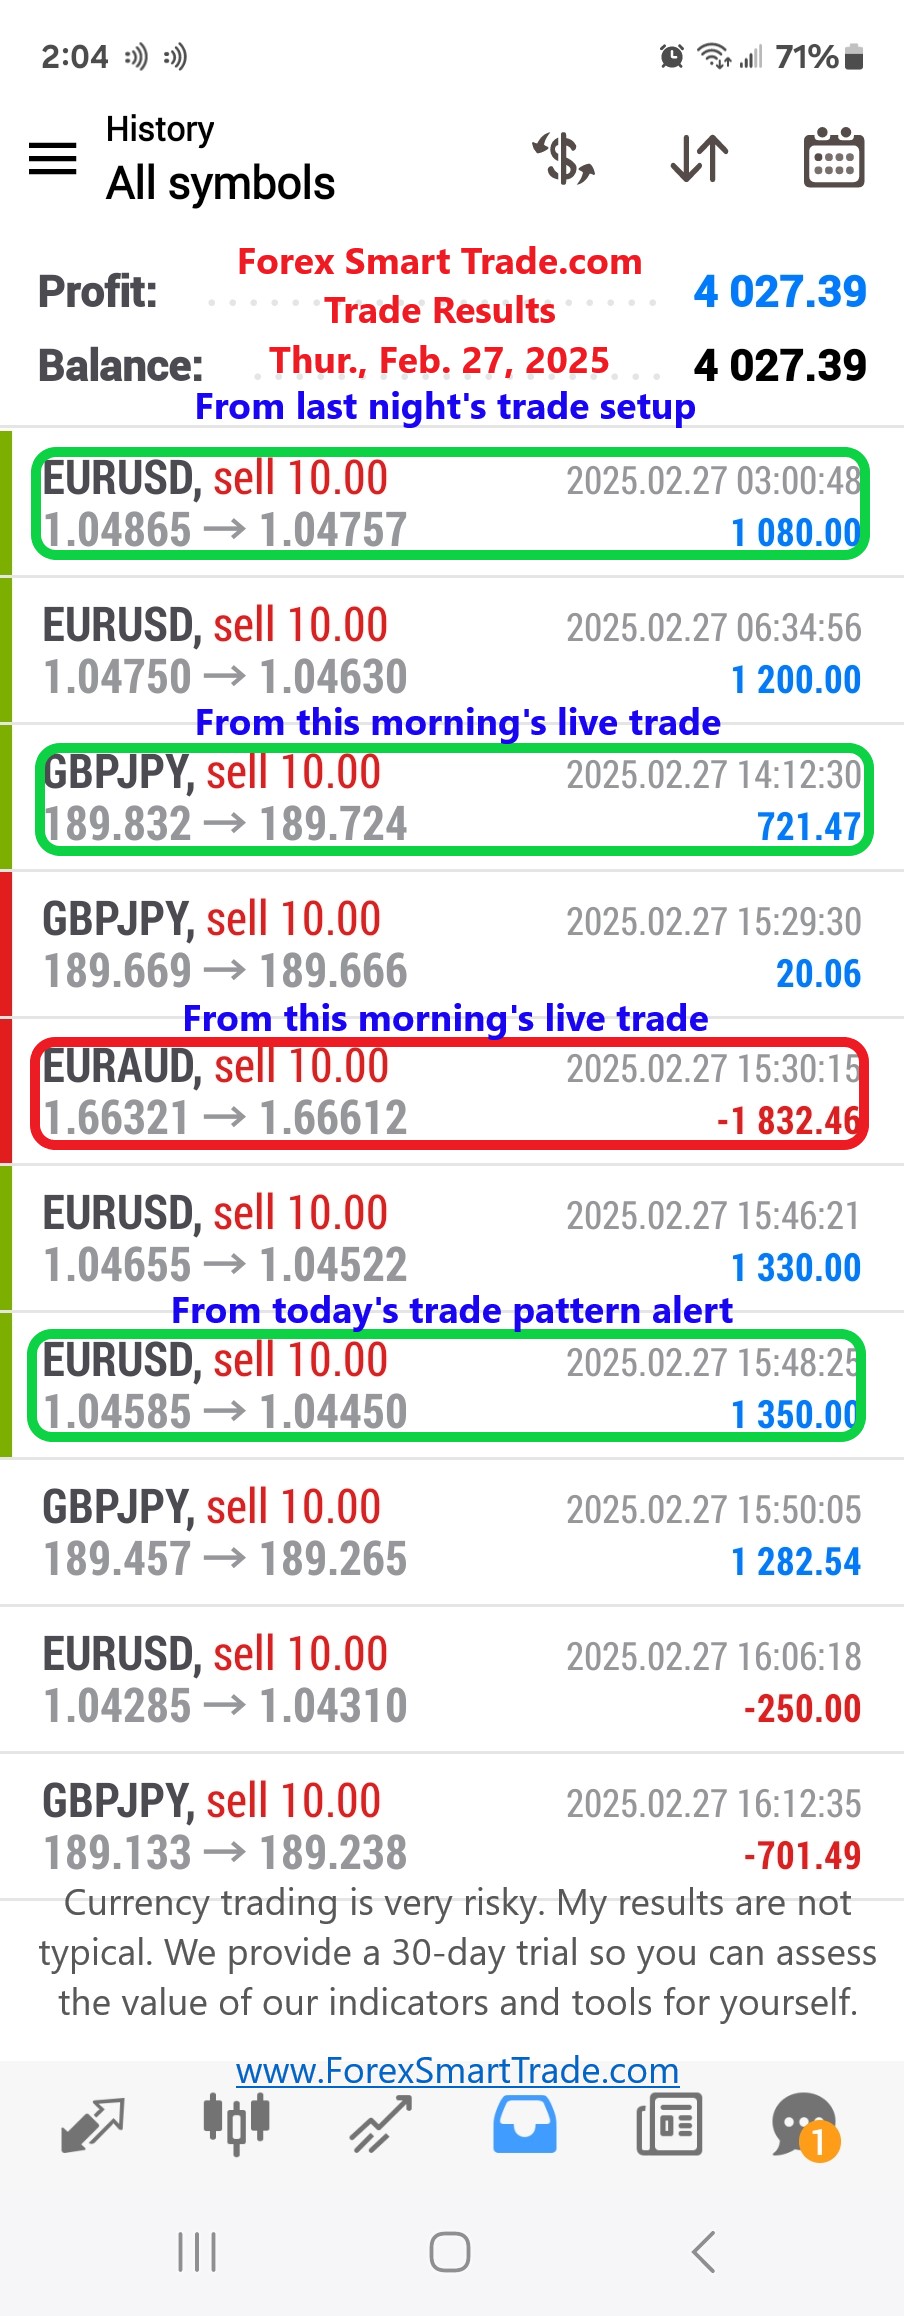
Forex Smart Trade Results, Thur., Feb. 27, 2025: $4,027
Are You Doing God’s Work… or Your Own? Ever feel like you’re drowning in responsibilities, chasing success but never quite catching it? You’re working hard, but […]
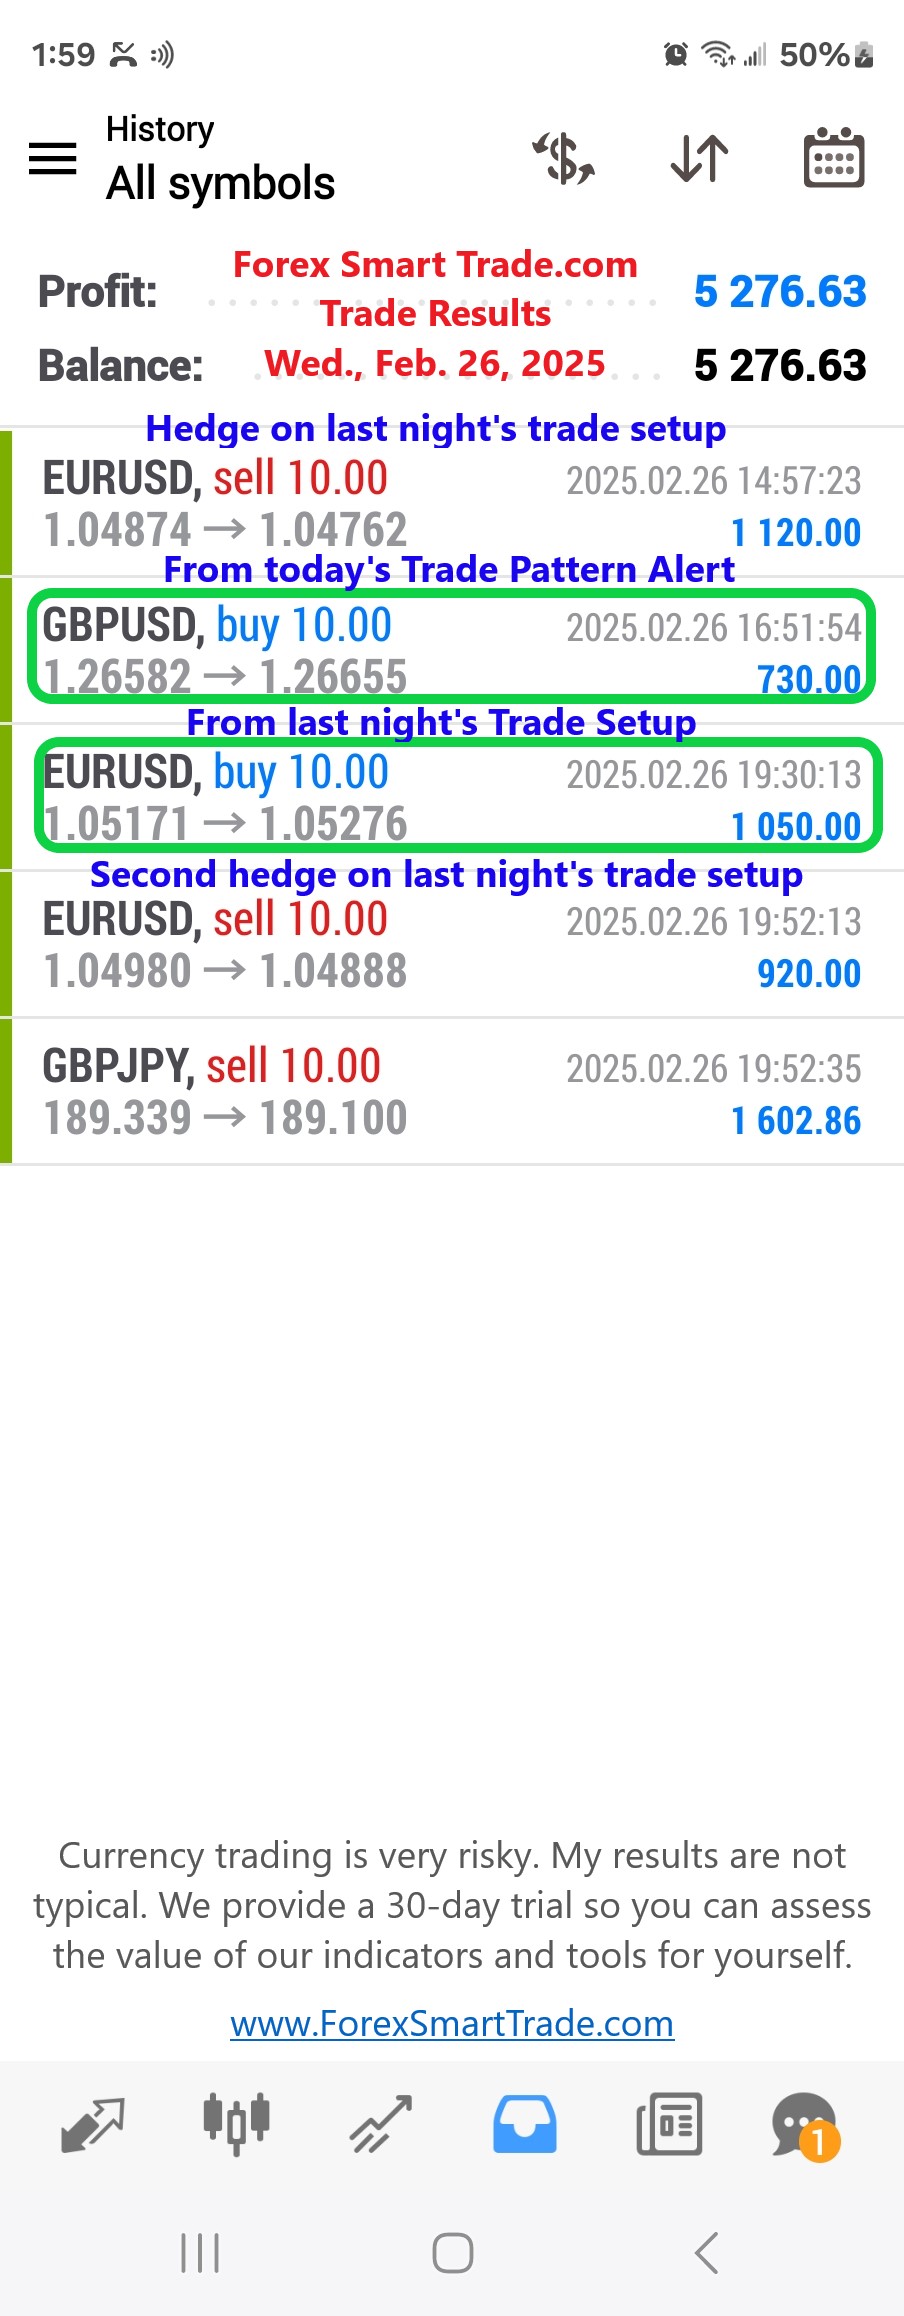
Forex Smart Trade Results, Wed., Feb. 26, 2025: $5,276
Are You Running on Empty? Here’s How to Change That. Eliud Kipchoge, the greatest distance runner of all time, has a secret to his longevity and […]
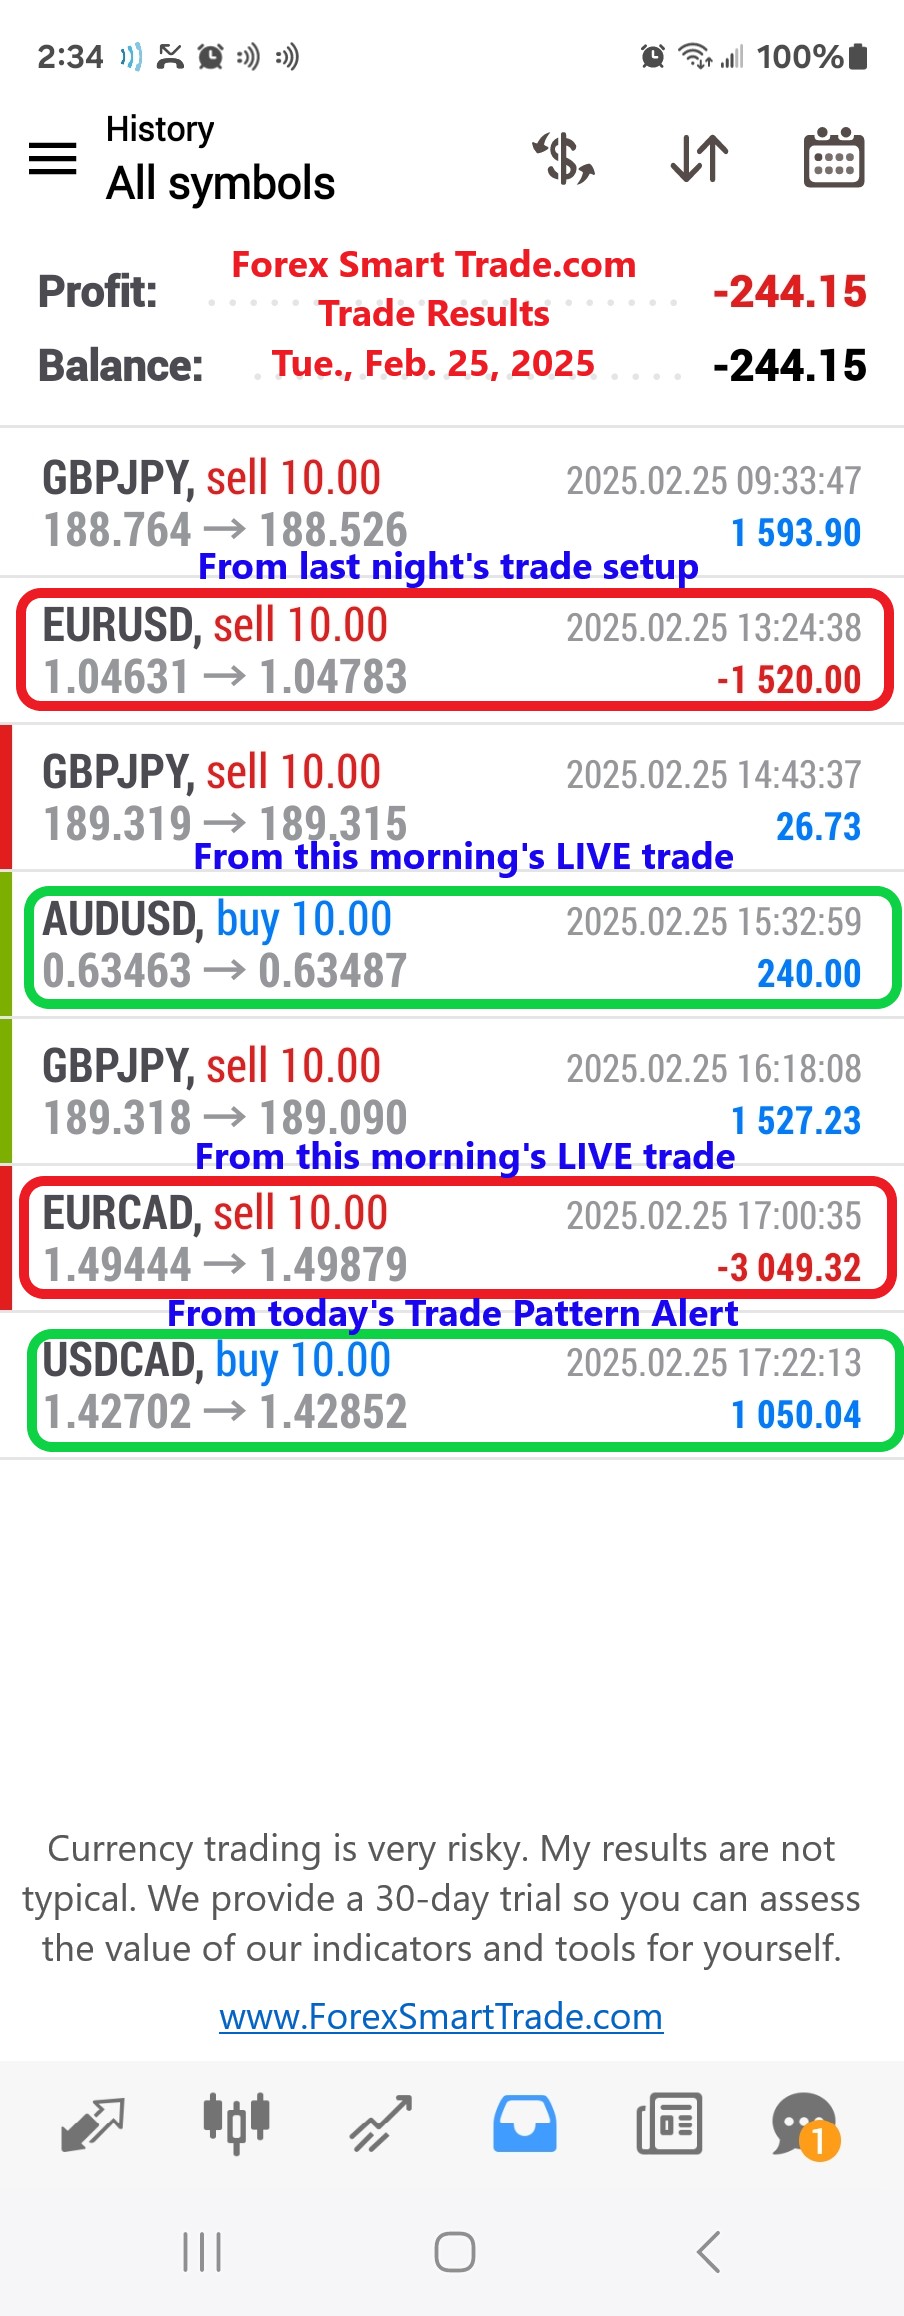
Forex Smart Trade Results, Tue., Feb. 25, 2025: ($244)
The Reality of Success: Embrace the Process and Win in Trading. Ever feel like you’re stuck? Like no matter how hard you try, something always seems […]
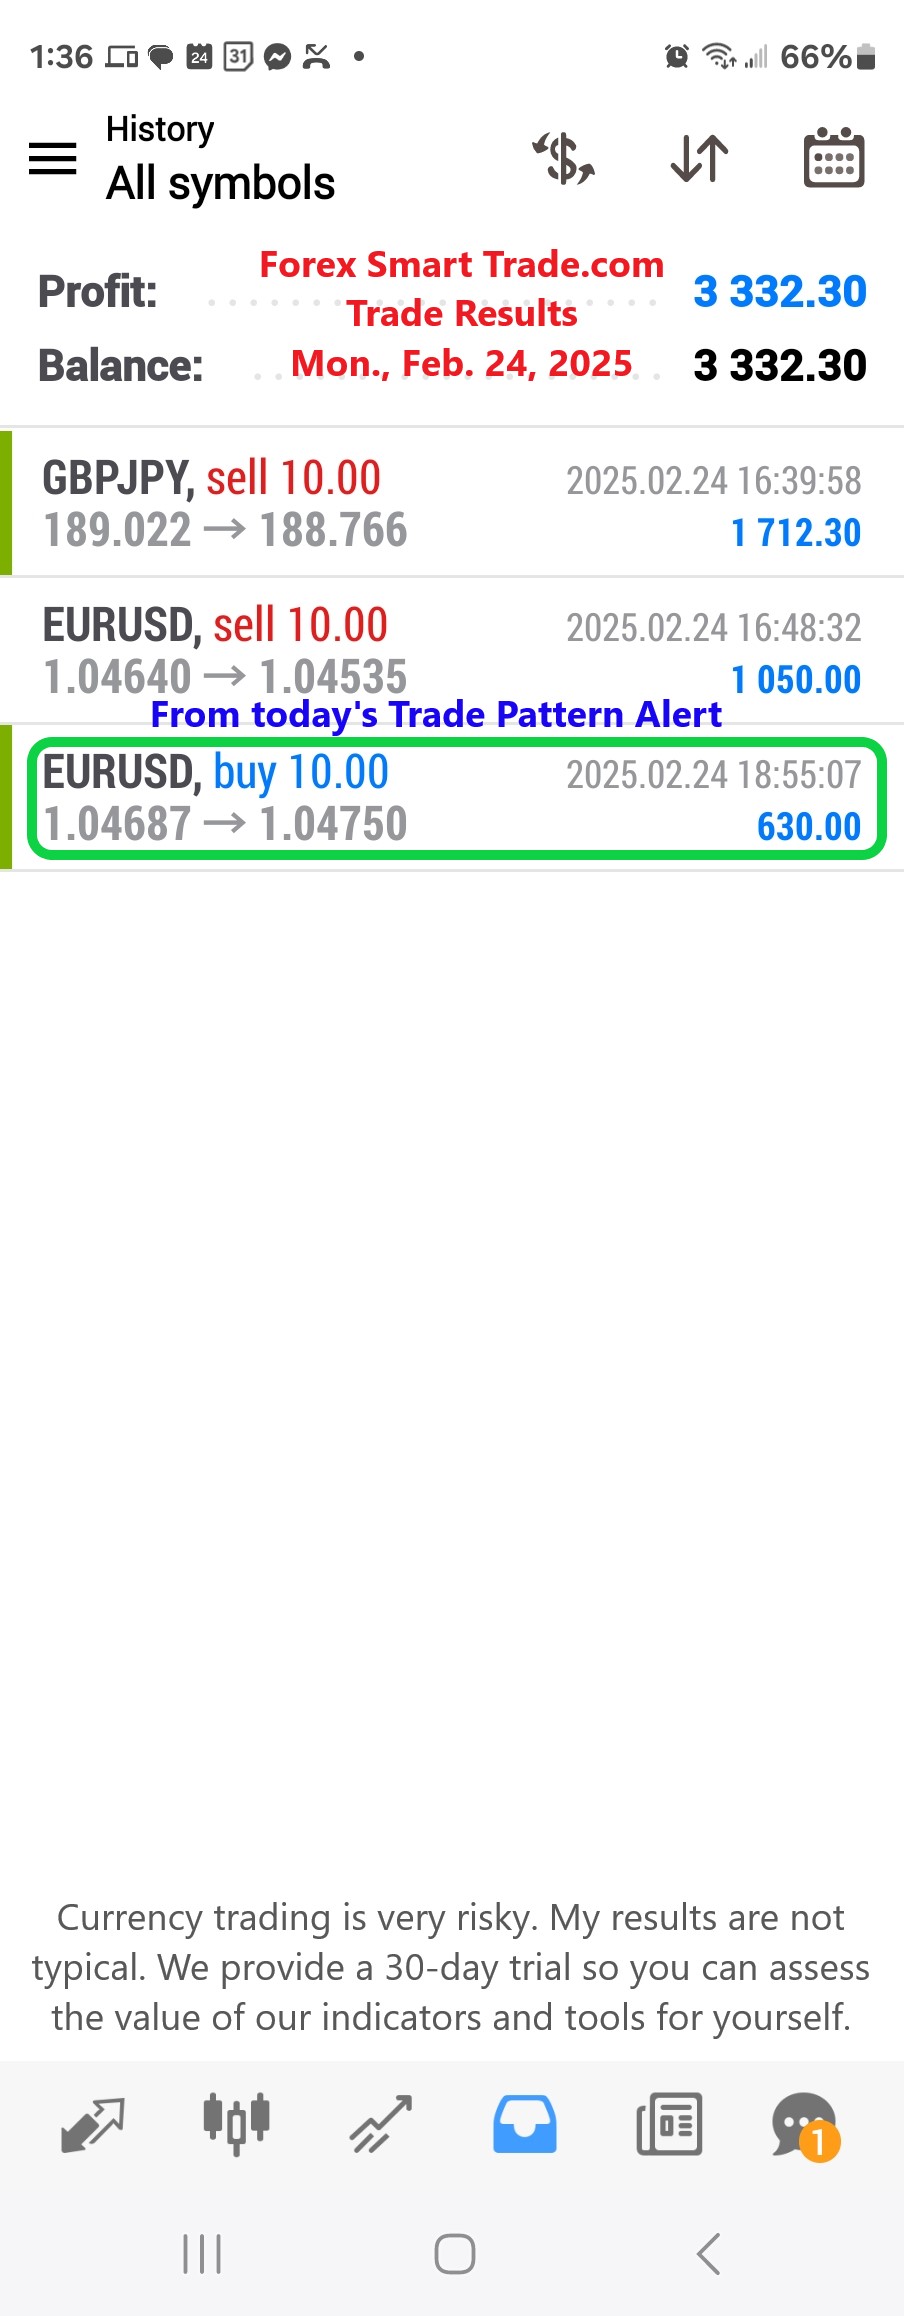
Forex Smart Trade Results, Mon., Feb. 24, 2025: $3,332
Stop Drawing Financial Monsters with Your Imagination. There’s a powerful scene Steve Chandler describes in his book “Time Warrior”: A man in a mental ward draws […]
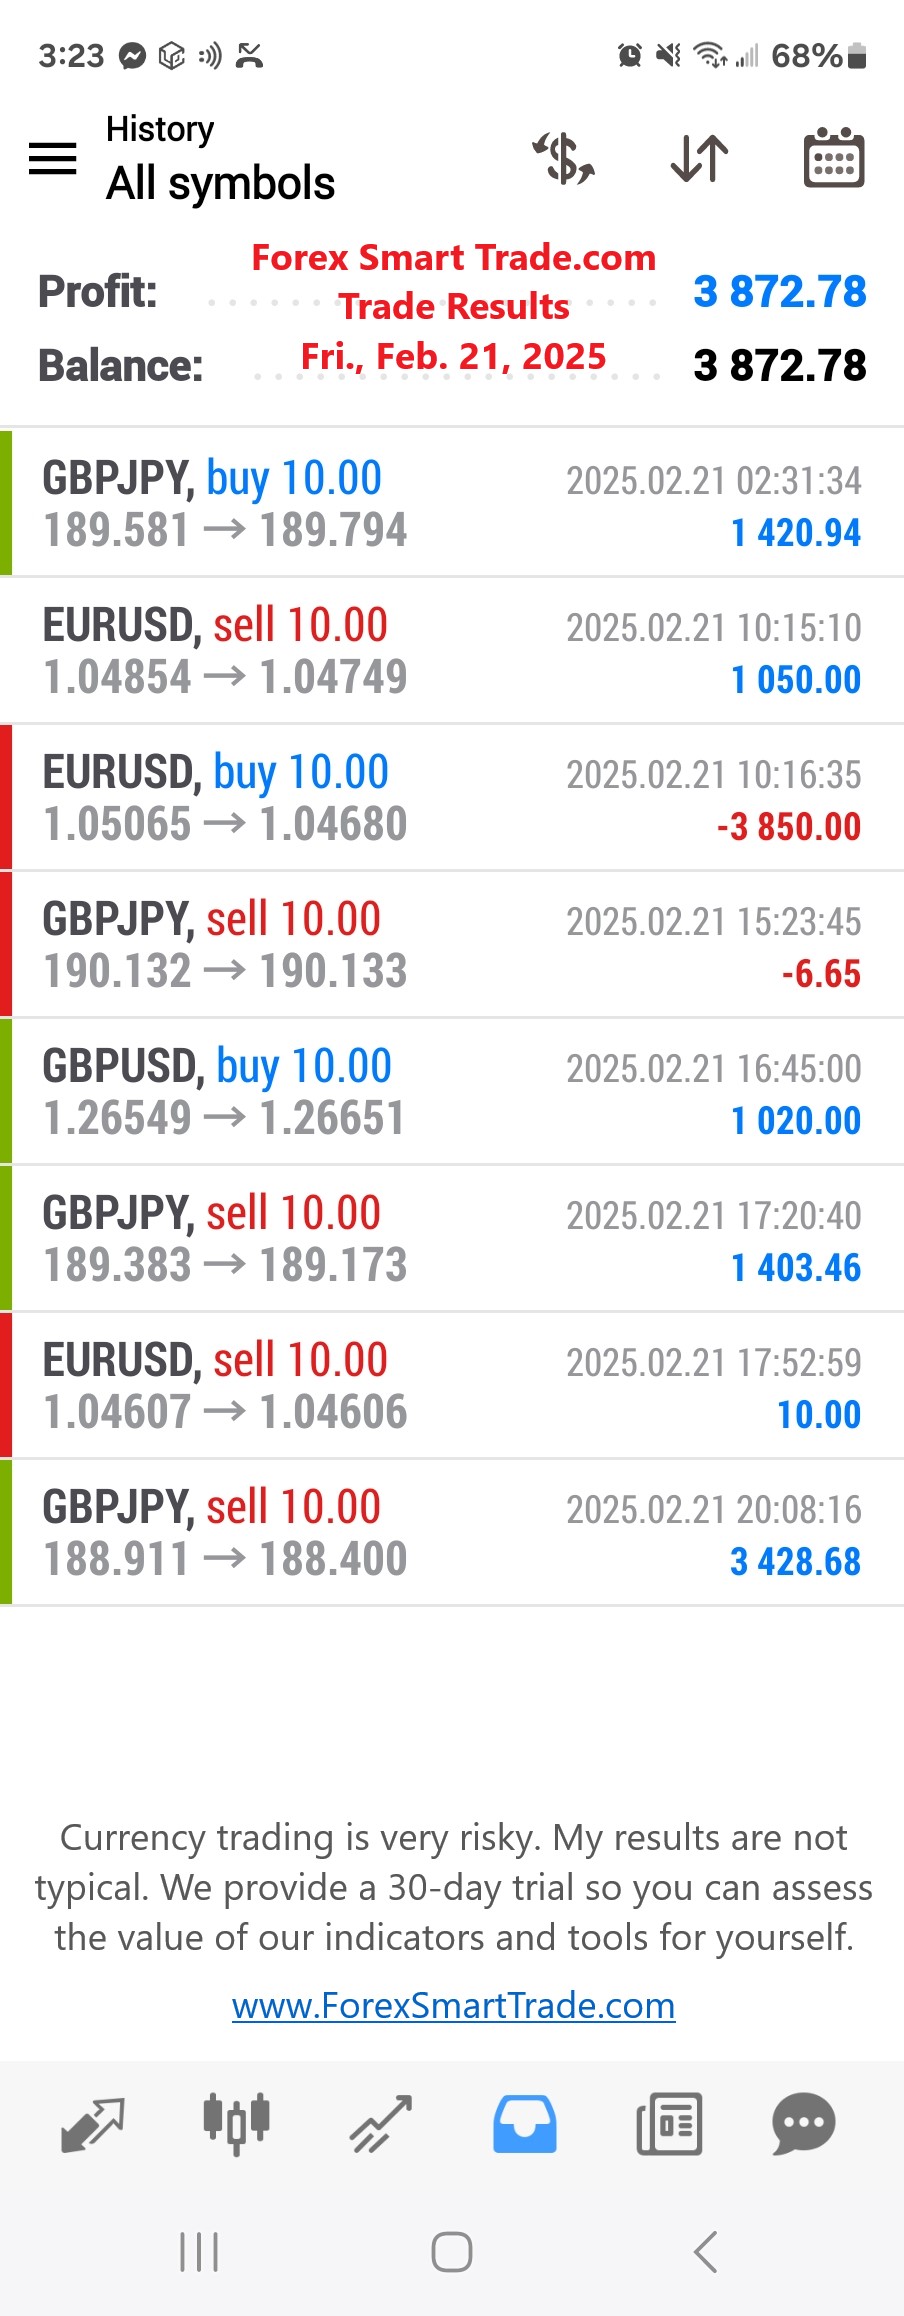
Forex Smart Trade Results, Fri., Feb. 21, 2025: $3,872
Trade Example: Buy EUR/USD. Here’s an example of a long trade setup: If we went back in time and looked at this chart, we would see […]
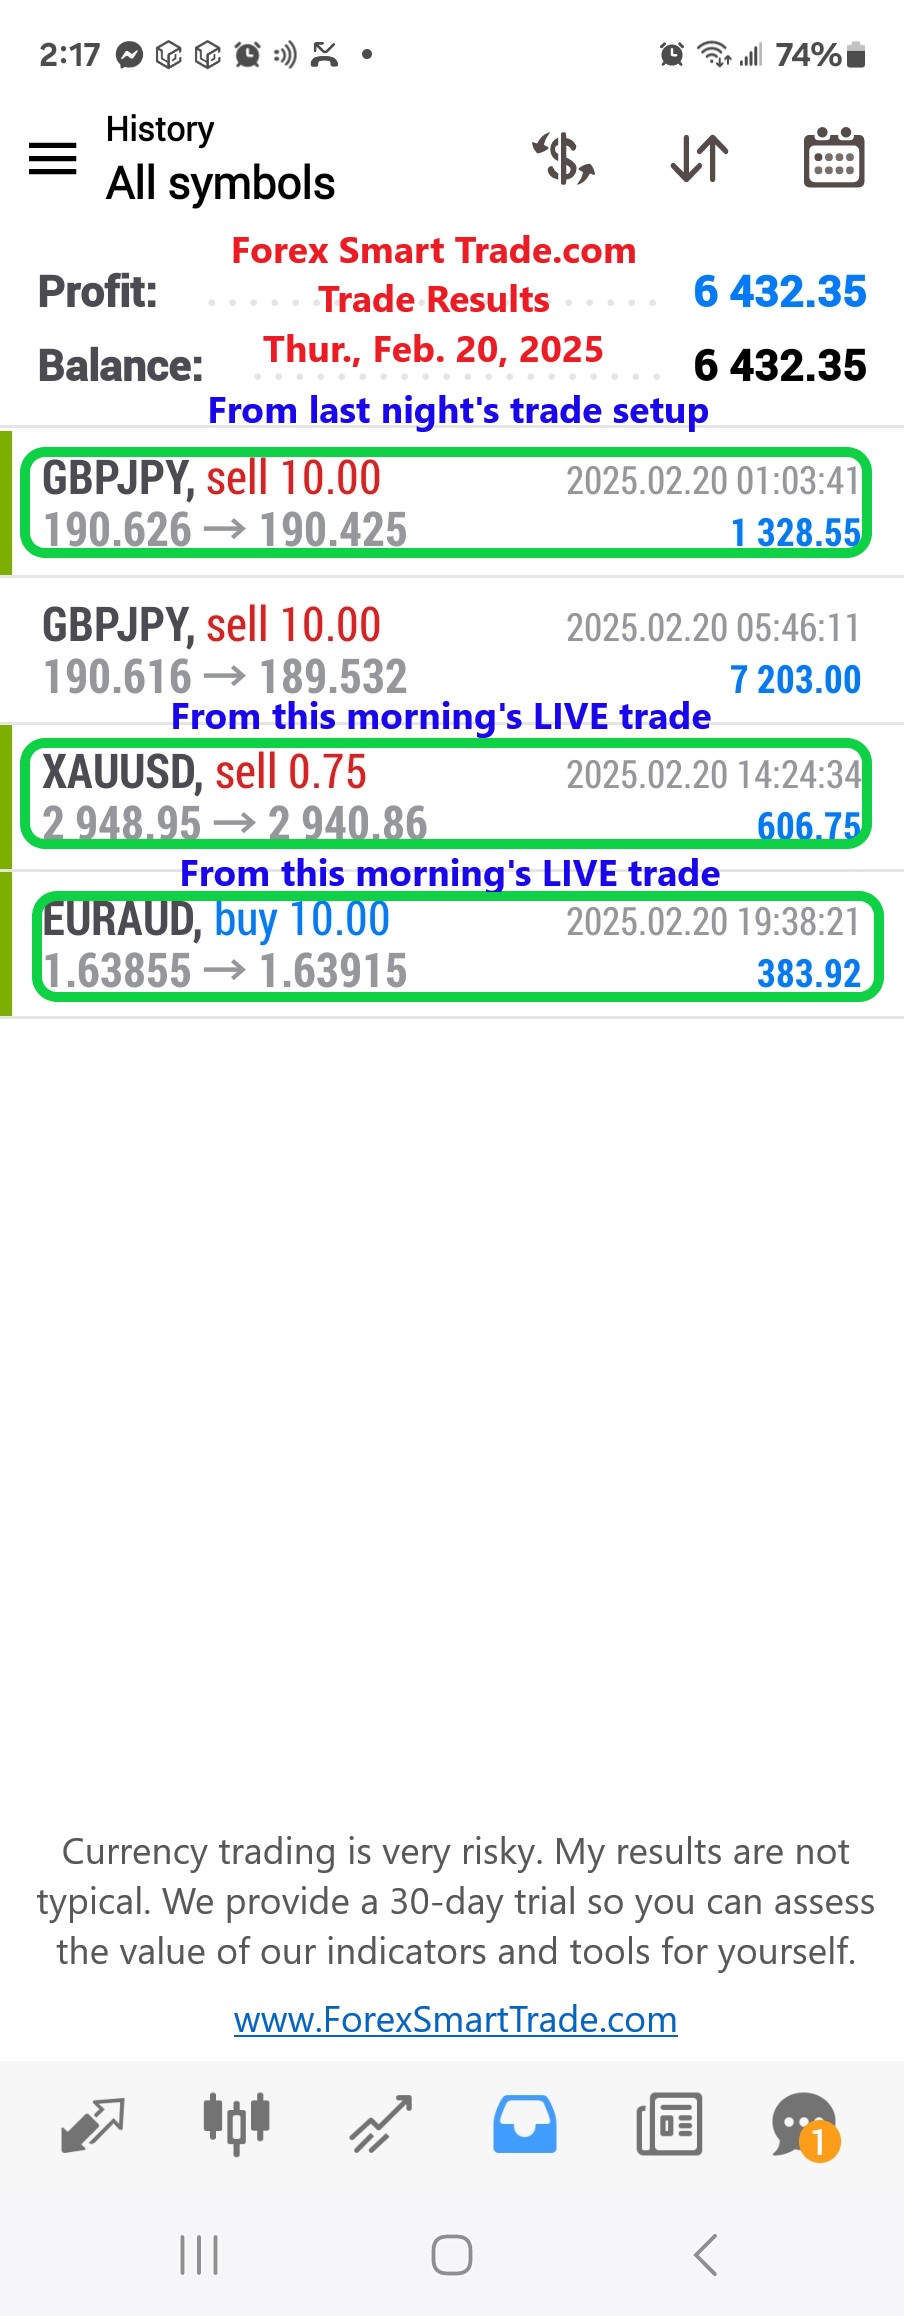
Forex Smart Trade Results, Thur., Feb. 20, 2025: $6,432
The Key to Trading Success: Small Changes Lead to Big Results. Mark Twain once said, “A cat who sits on a hot stove will never sit […]
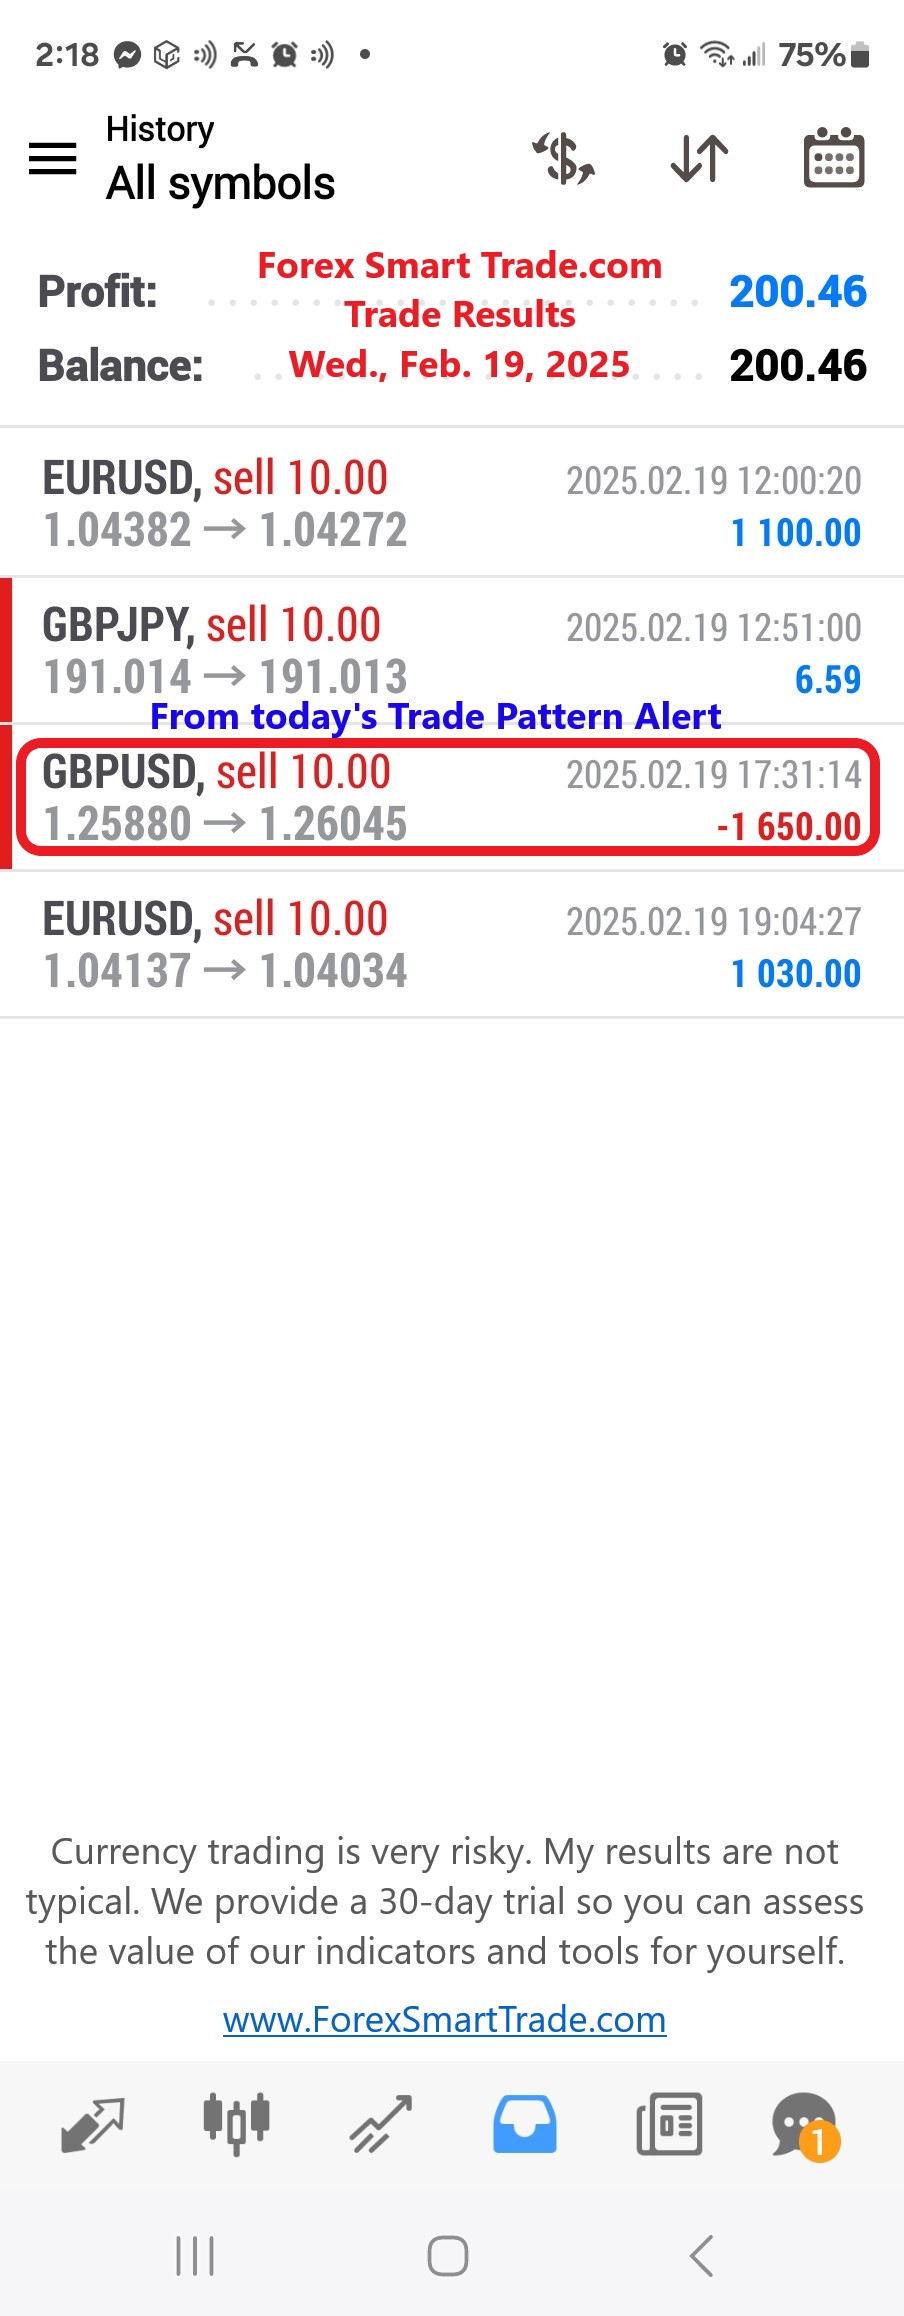
Forex Smart Trade Results, Wed., Feb. 19, 2025: $200
The Price of Success: Are You Willing to Pay It? Most people never take the time to get crystal clear on what they really (REALLY, REALLY, REALLY!) want […]
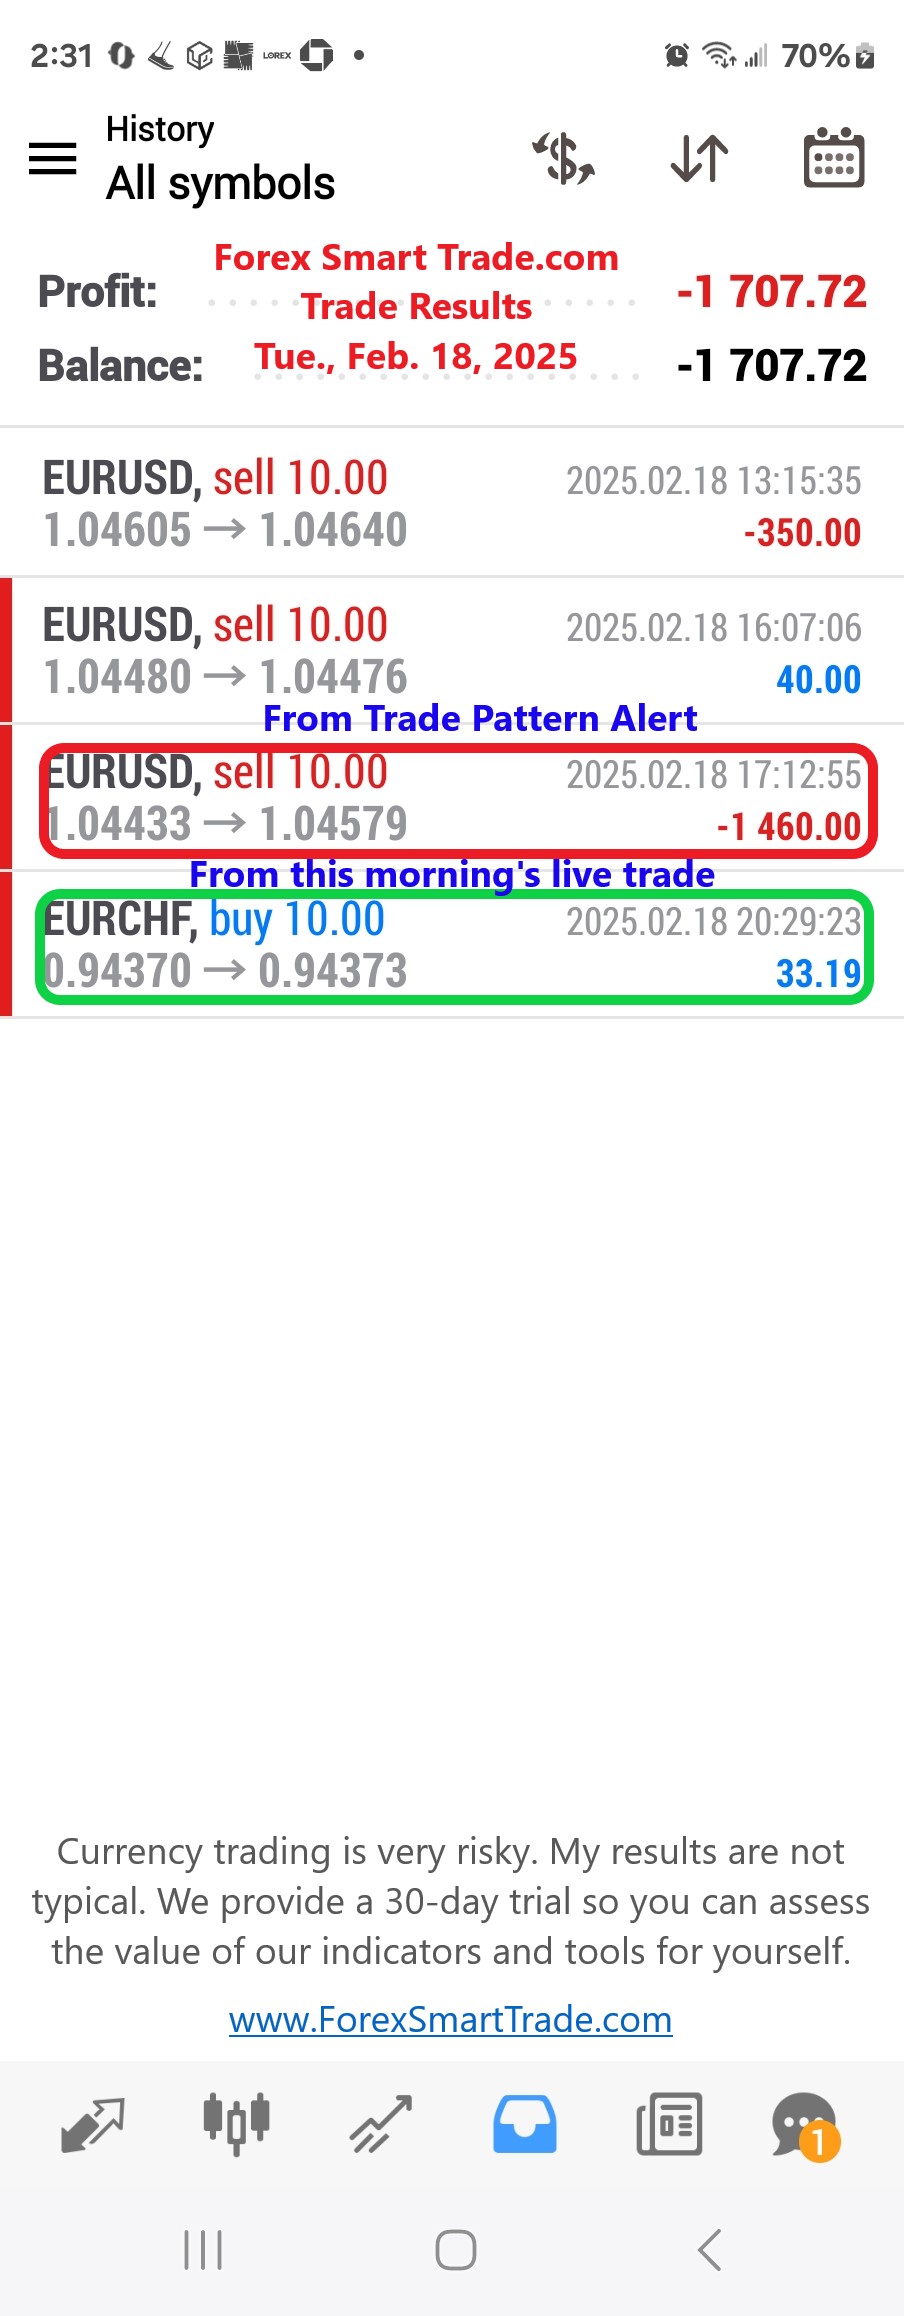
Forex Smart Trade Results, Tue., Feb. 18, 2025: ($1,707)
The Game of Success: Start, Learn, and Win. Ever heard of Angry Birds? You probably have. But did you know that before hitting it big, Rovio […]
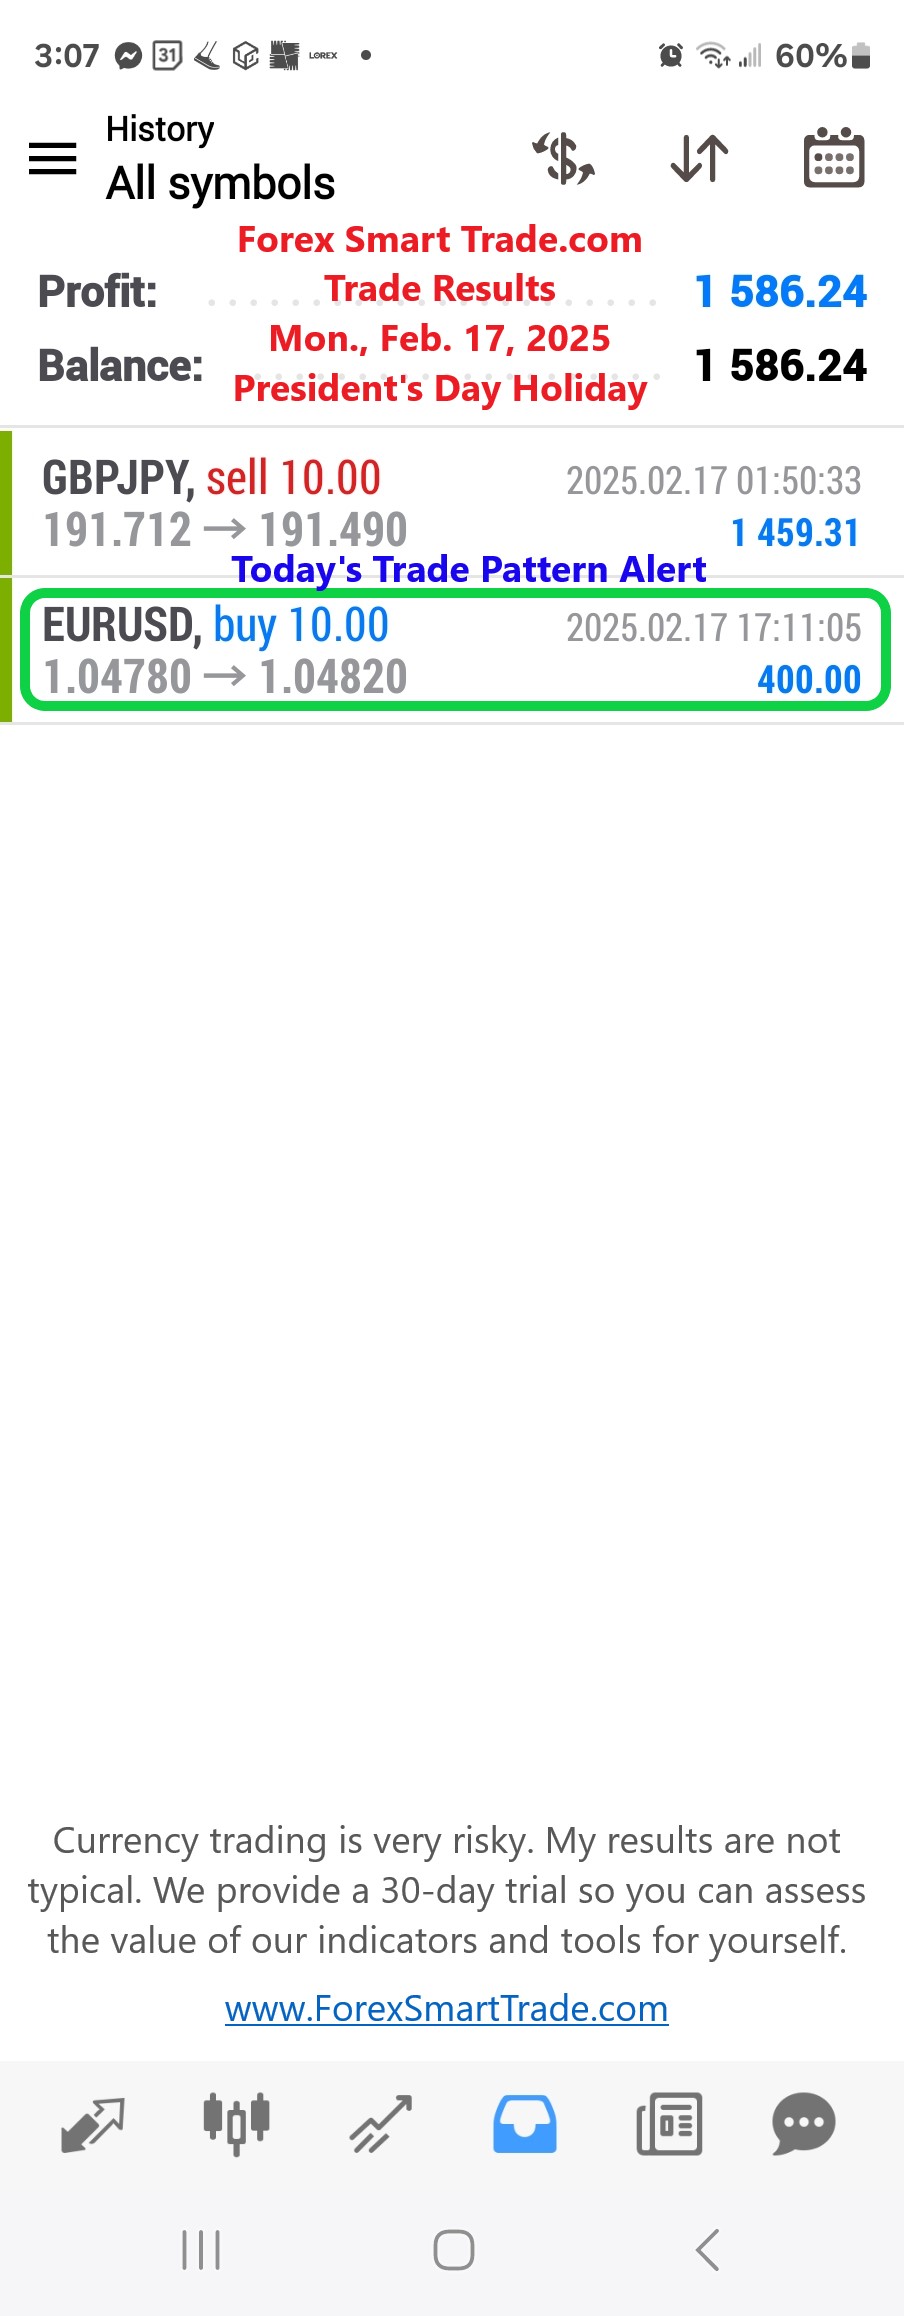
Forex Smart Trade Results, Mon., Feb. 17, 2025: $1,586
Stop Thinking Like Everyone Else — Start Winning Like a Trader. Most people go through life playing the same game, following the same rules, and wondering […]
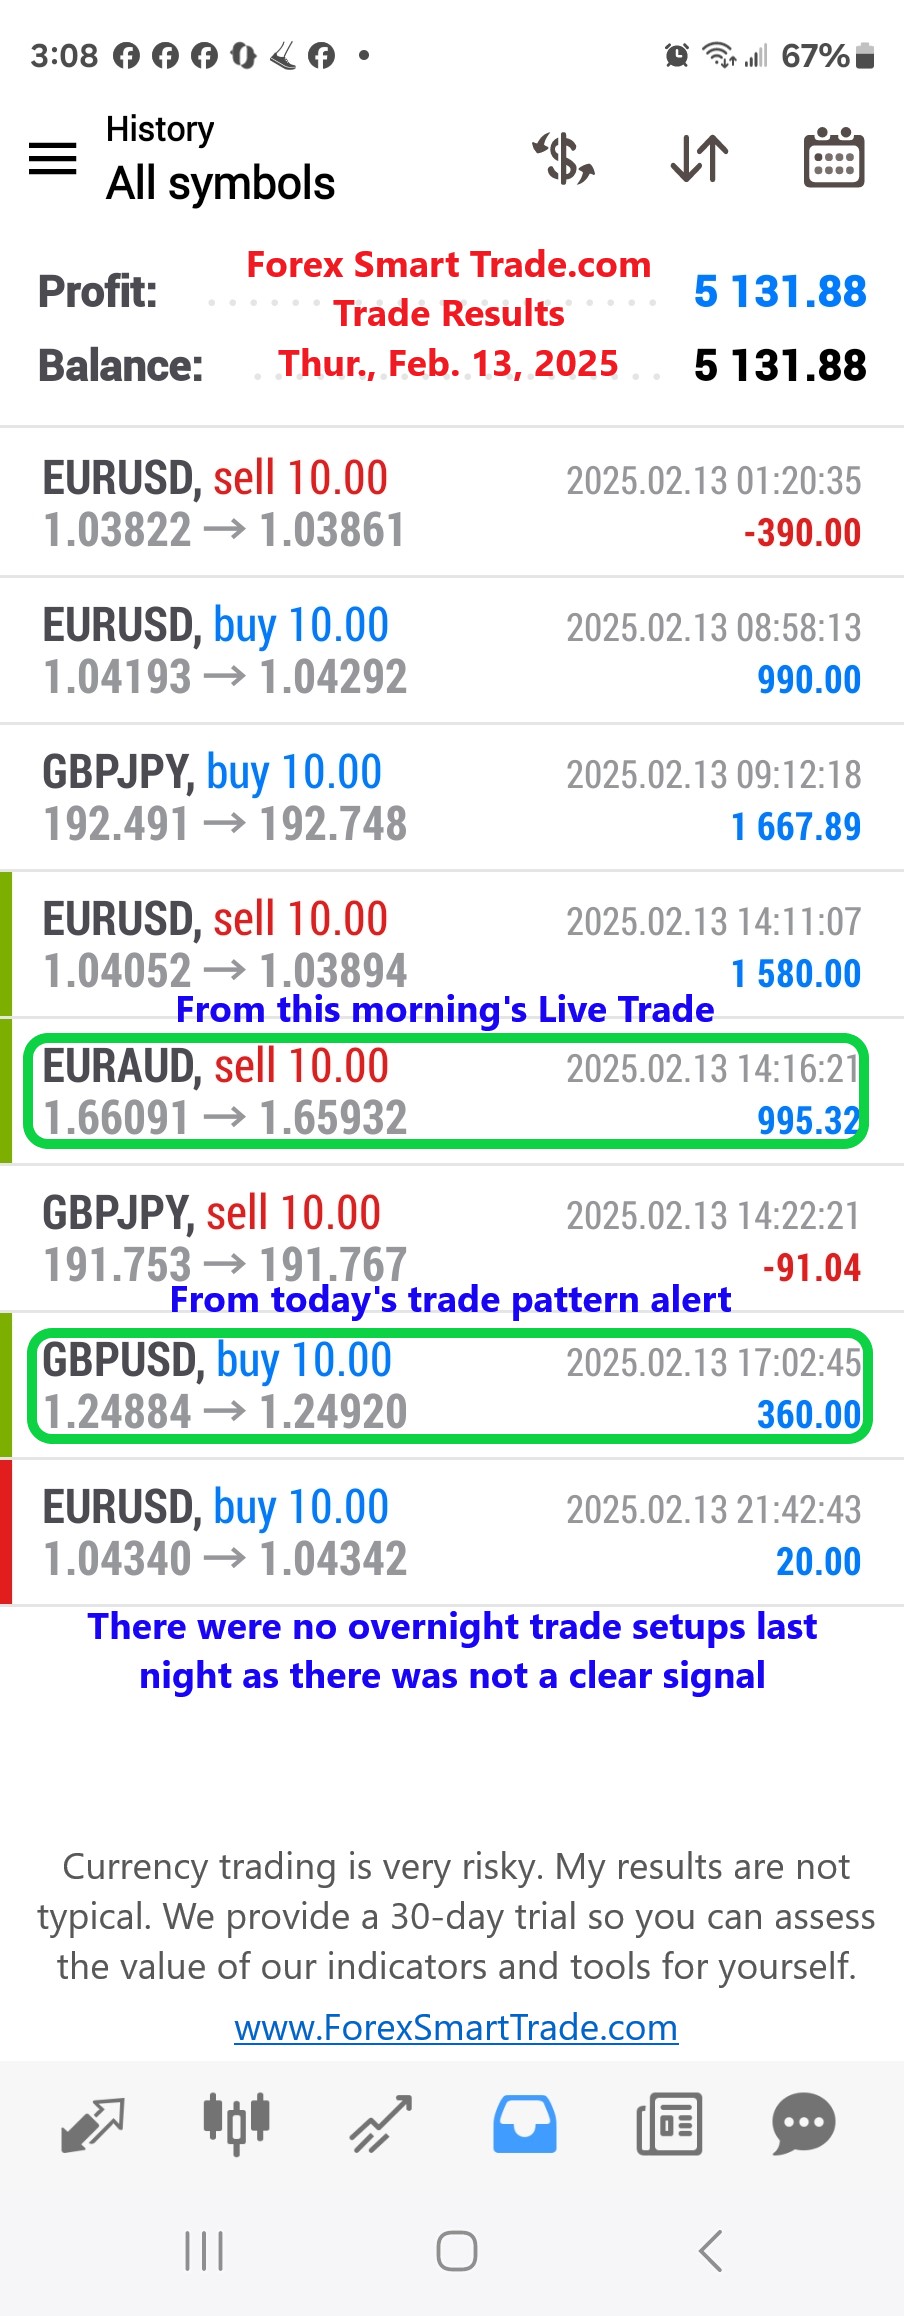
Forex Smart Trade Results, Thur., Feb. 13, 2025: $5,131
The “So Easy It’s Ridiculous” Trading System. As you can see, we have all the components of a good forex trading system. First, we’ve decided that […]
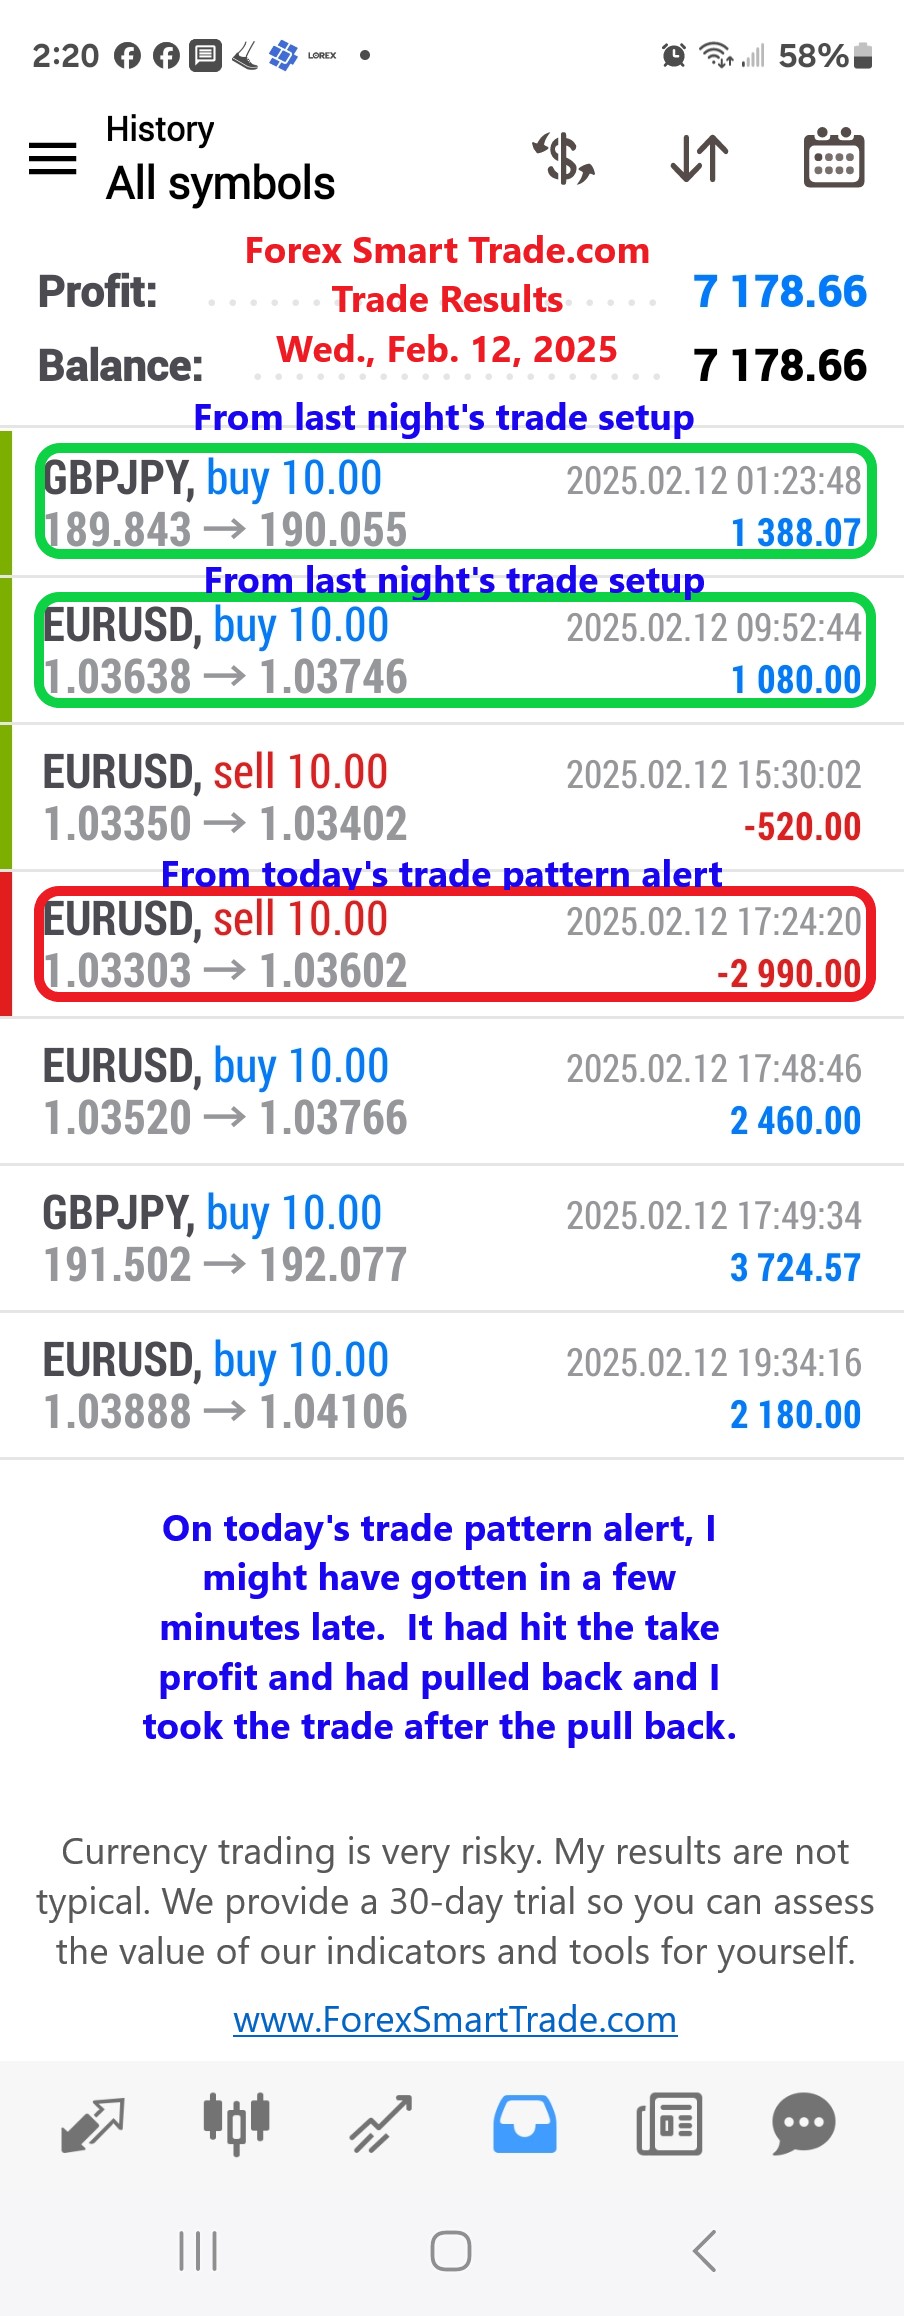
Forex Smart Trade Results, Wed., Feb. 12, 2025: $7,178
Mastering Your Mindset in Trading and Life: The Power of “Preferred Indifferents” There’s a fundamental truth about success — whether in trading, business, or life — that most people never […]
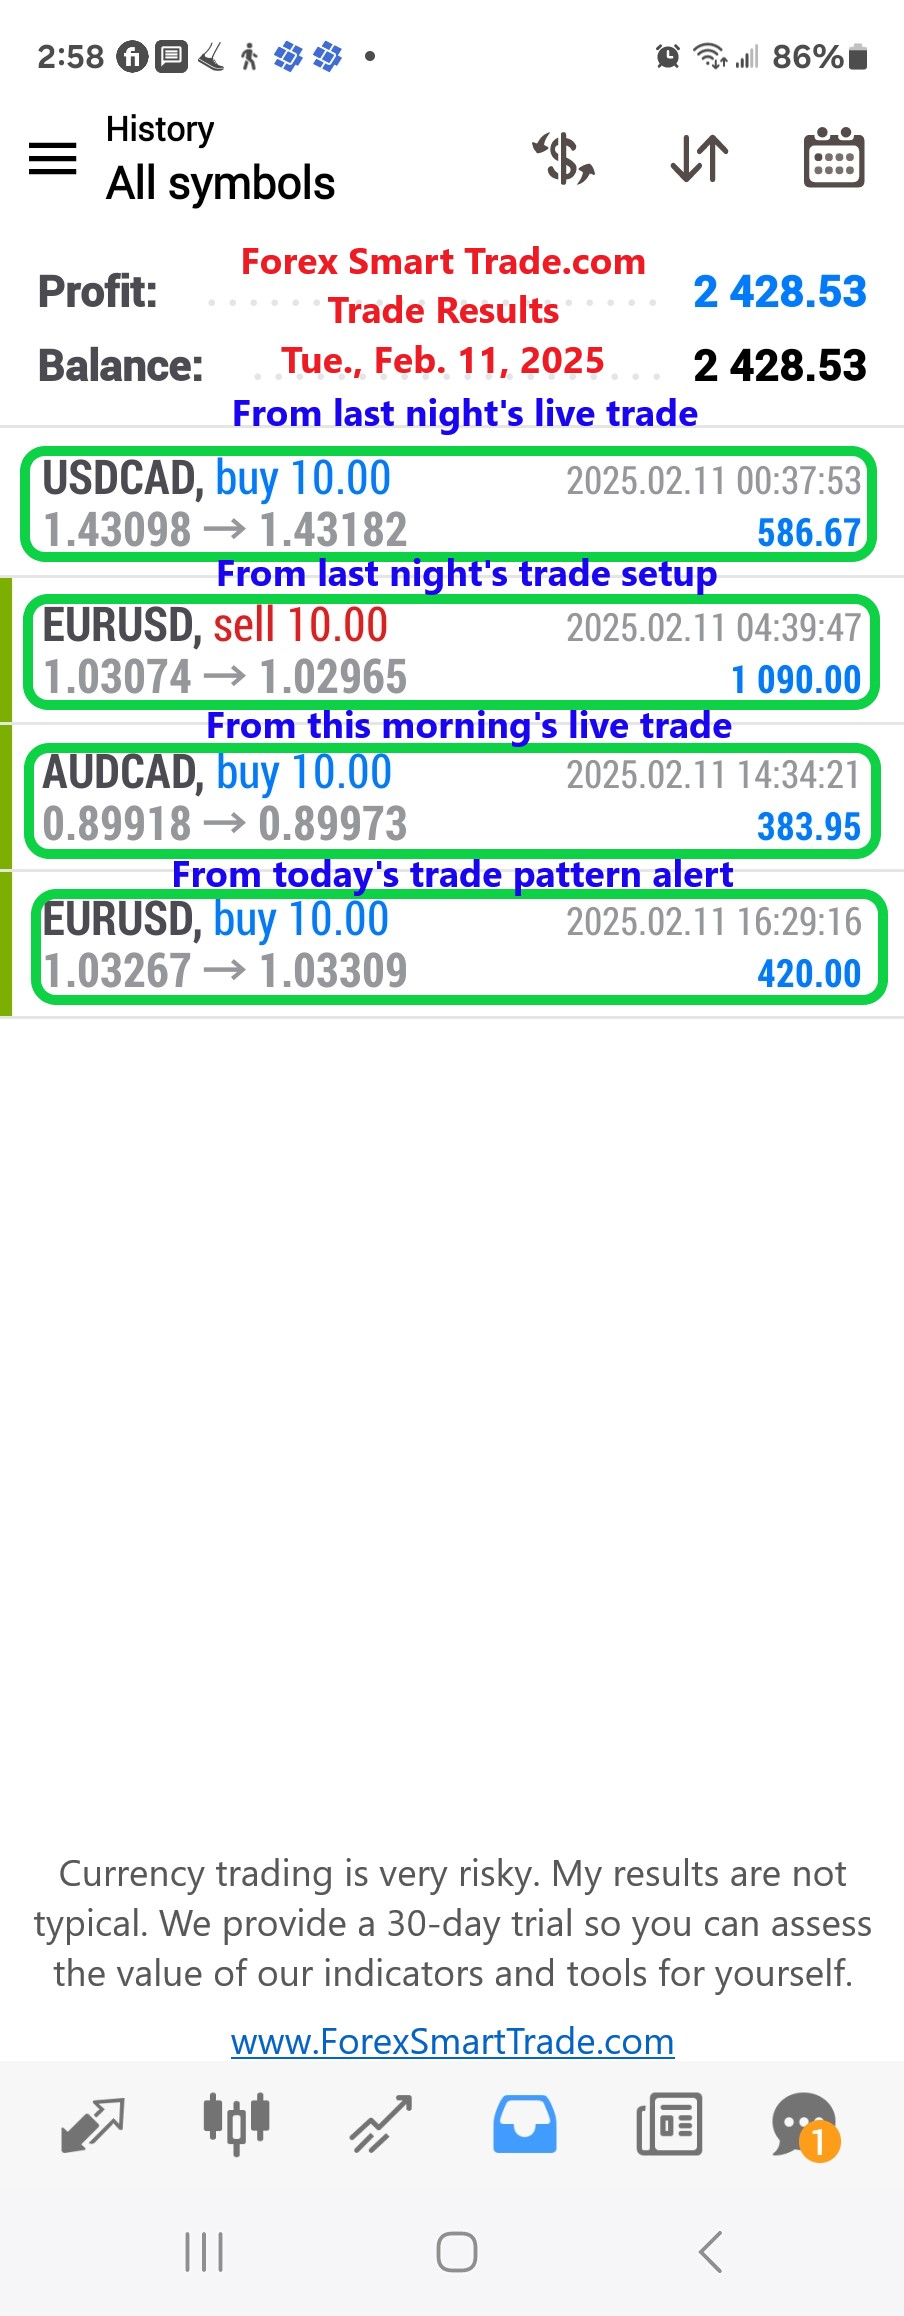
Forex Smart Trade Results, Tue., Feb. 11, 2025: $2,428
Mastering Your 24 Hours: A Lesson from Arnold Bennett. Even if you’re deep into personal development, chances are you haven’t studied How to Live on 24 […]
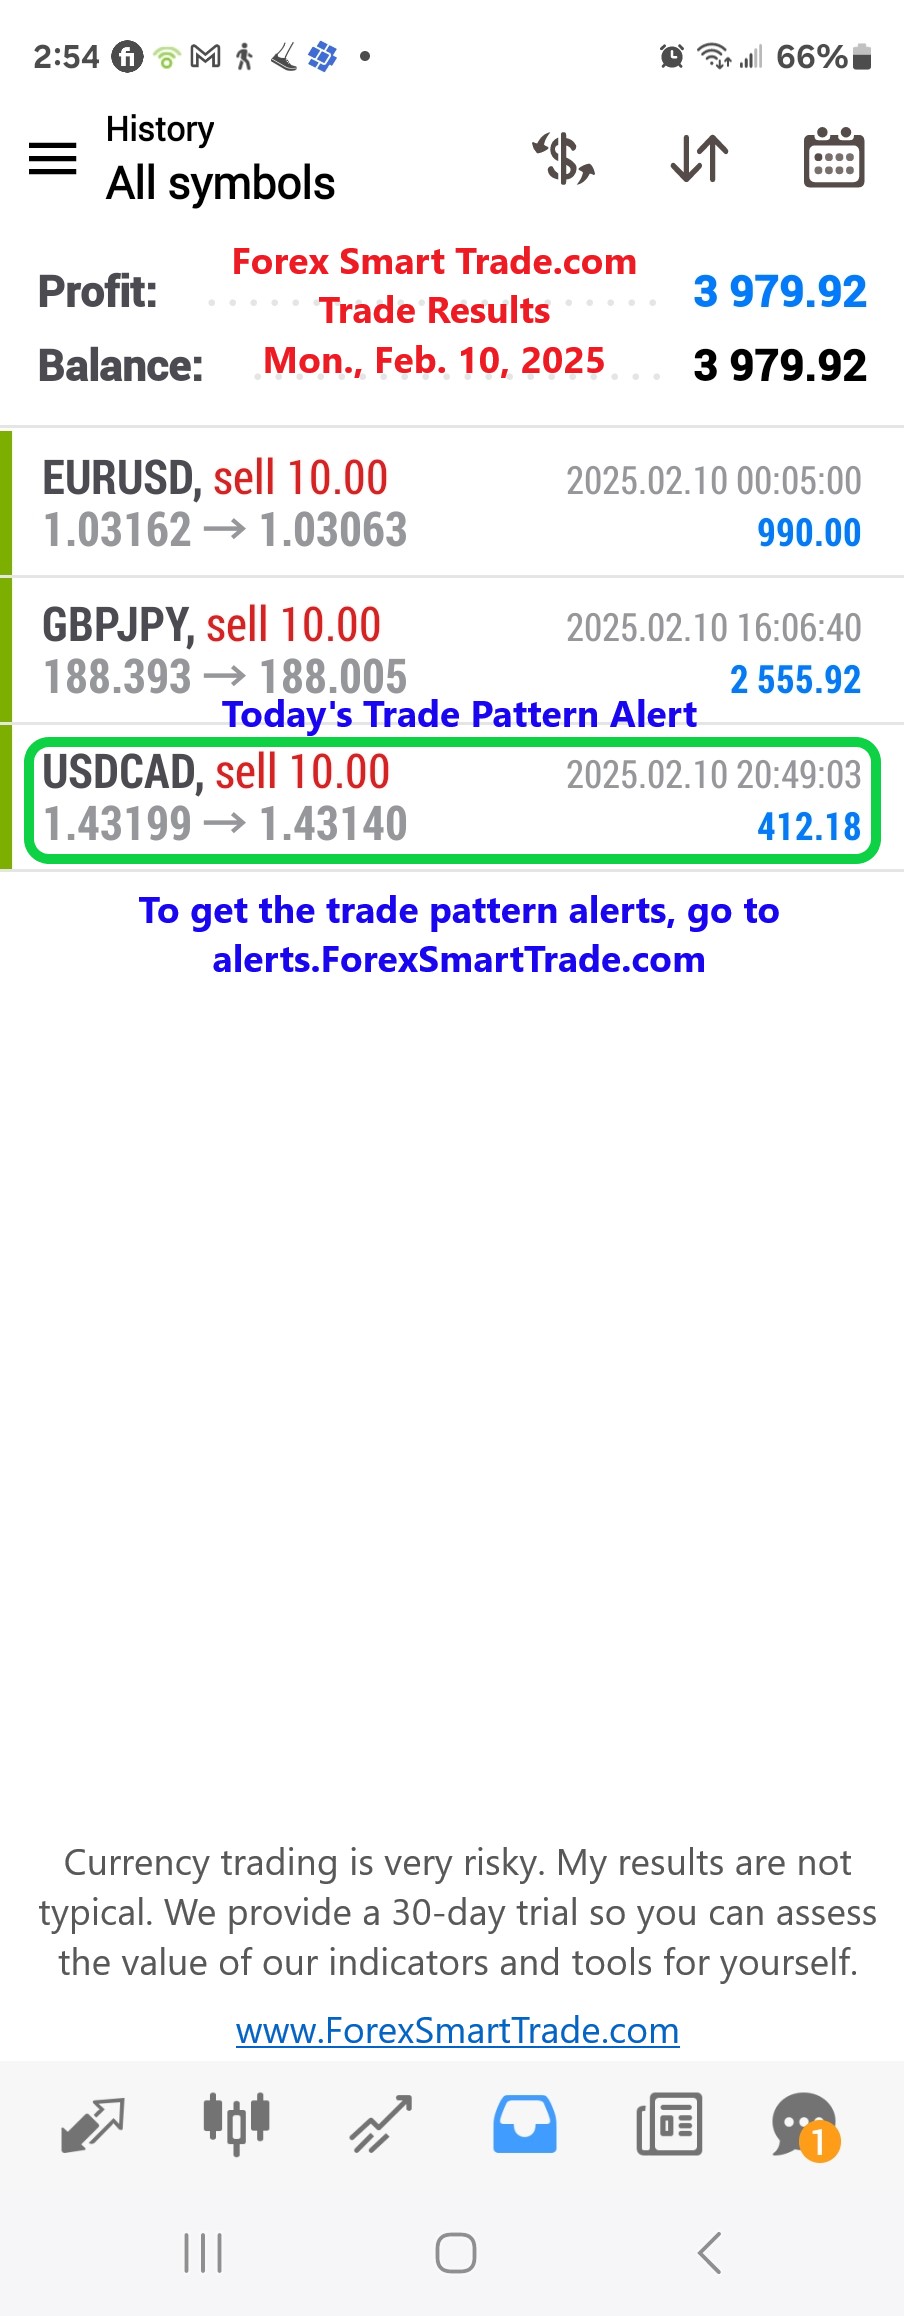
Forex Smart Trade Results, Mon., Feb. 10, 2025: $3,979
A Tiny Habit That Leads to Big Success… Even in Trading. What if I told you a simple thing like taking off your socks the right […]
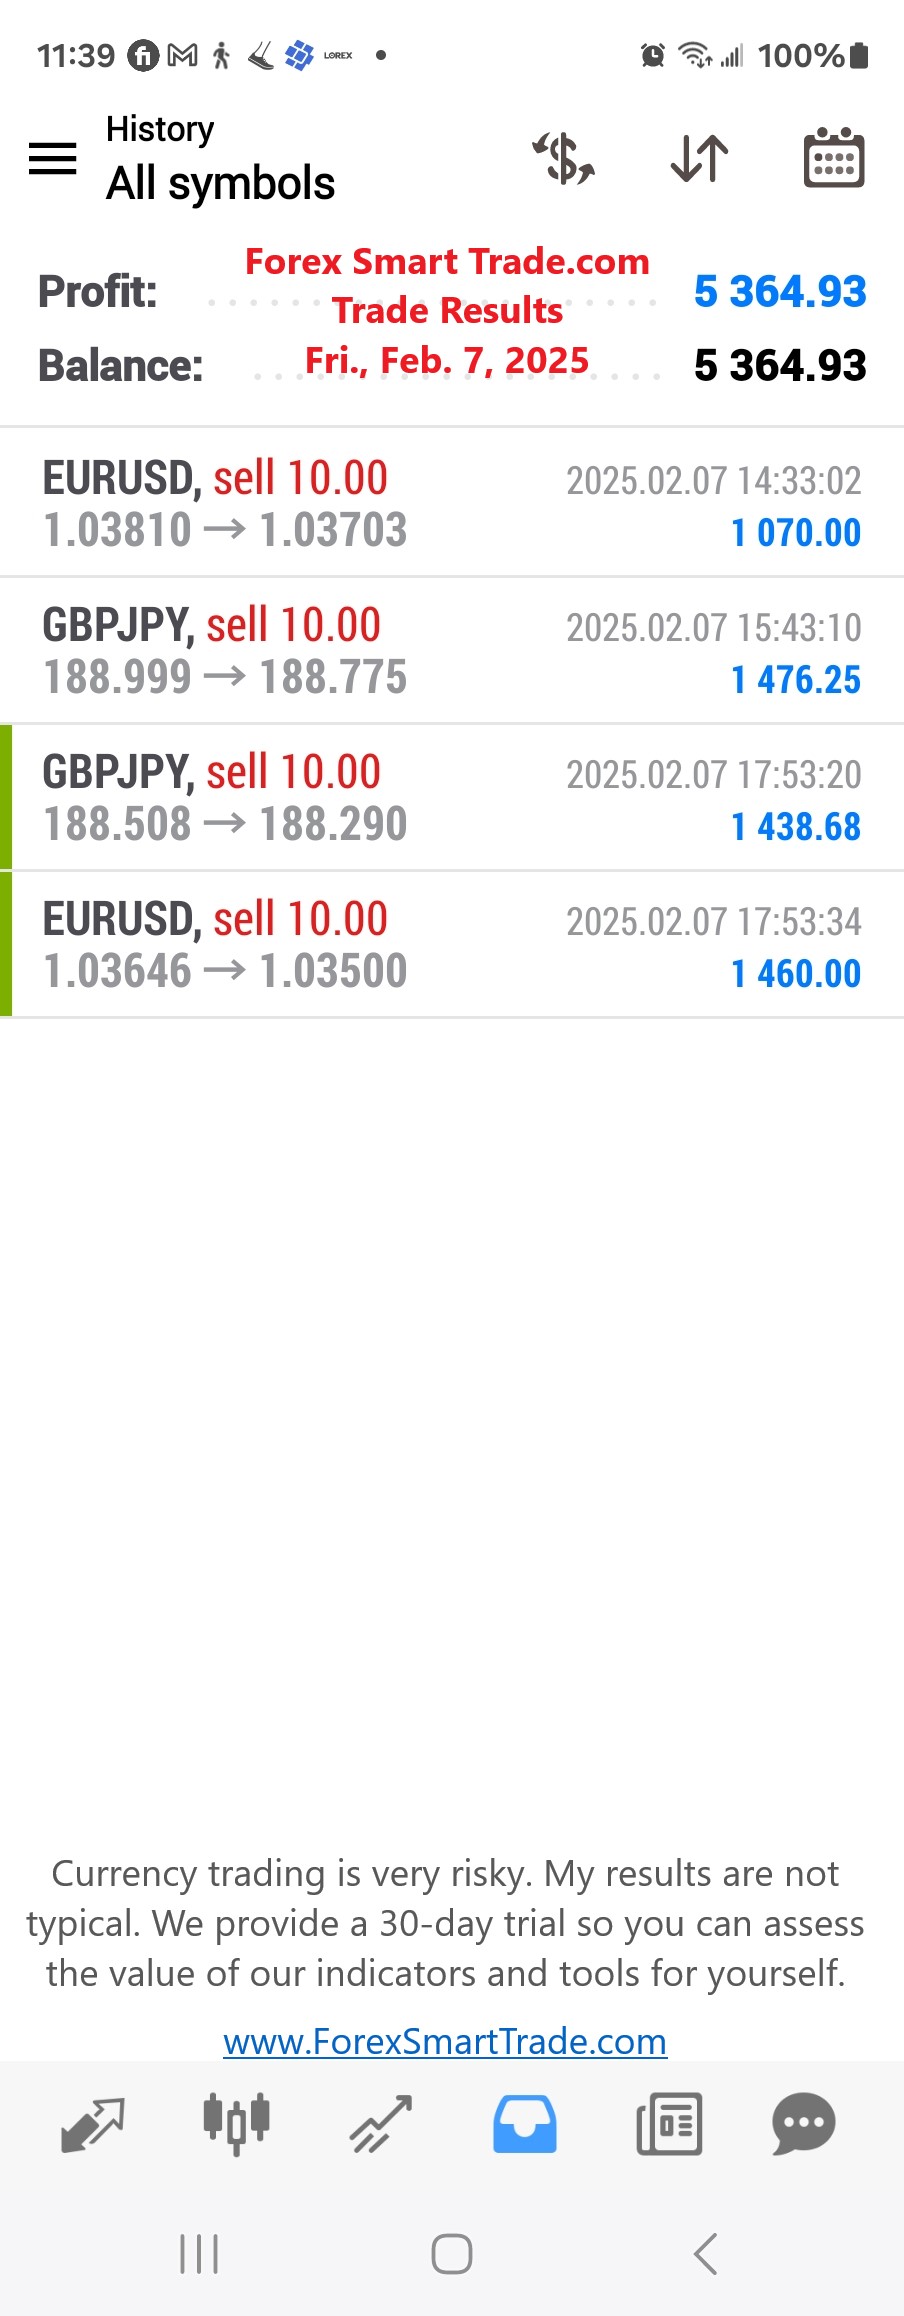
Forex Smart Trade Results, Fri., Feb. 7, 2025: $5,364
Should you scalp? Scalping is something that intrigues many system traders. The challenge of taking small, consistent trades from the market daily while risking very little […]
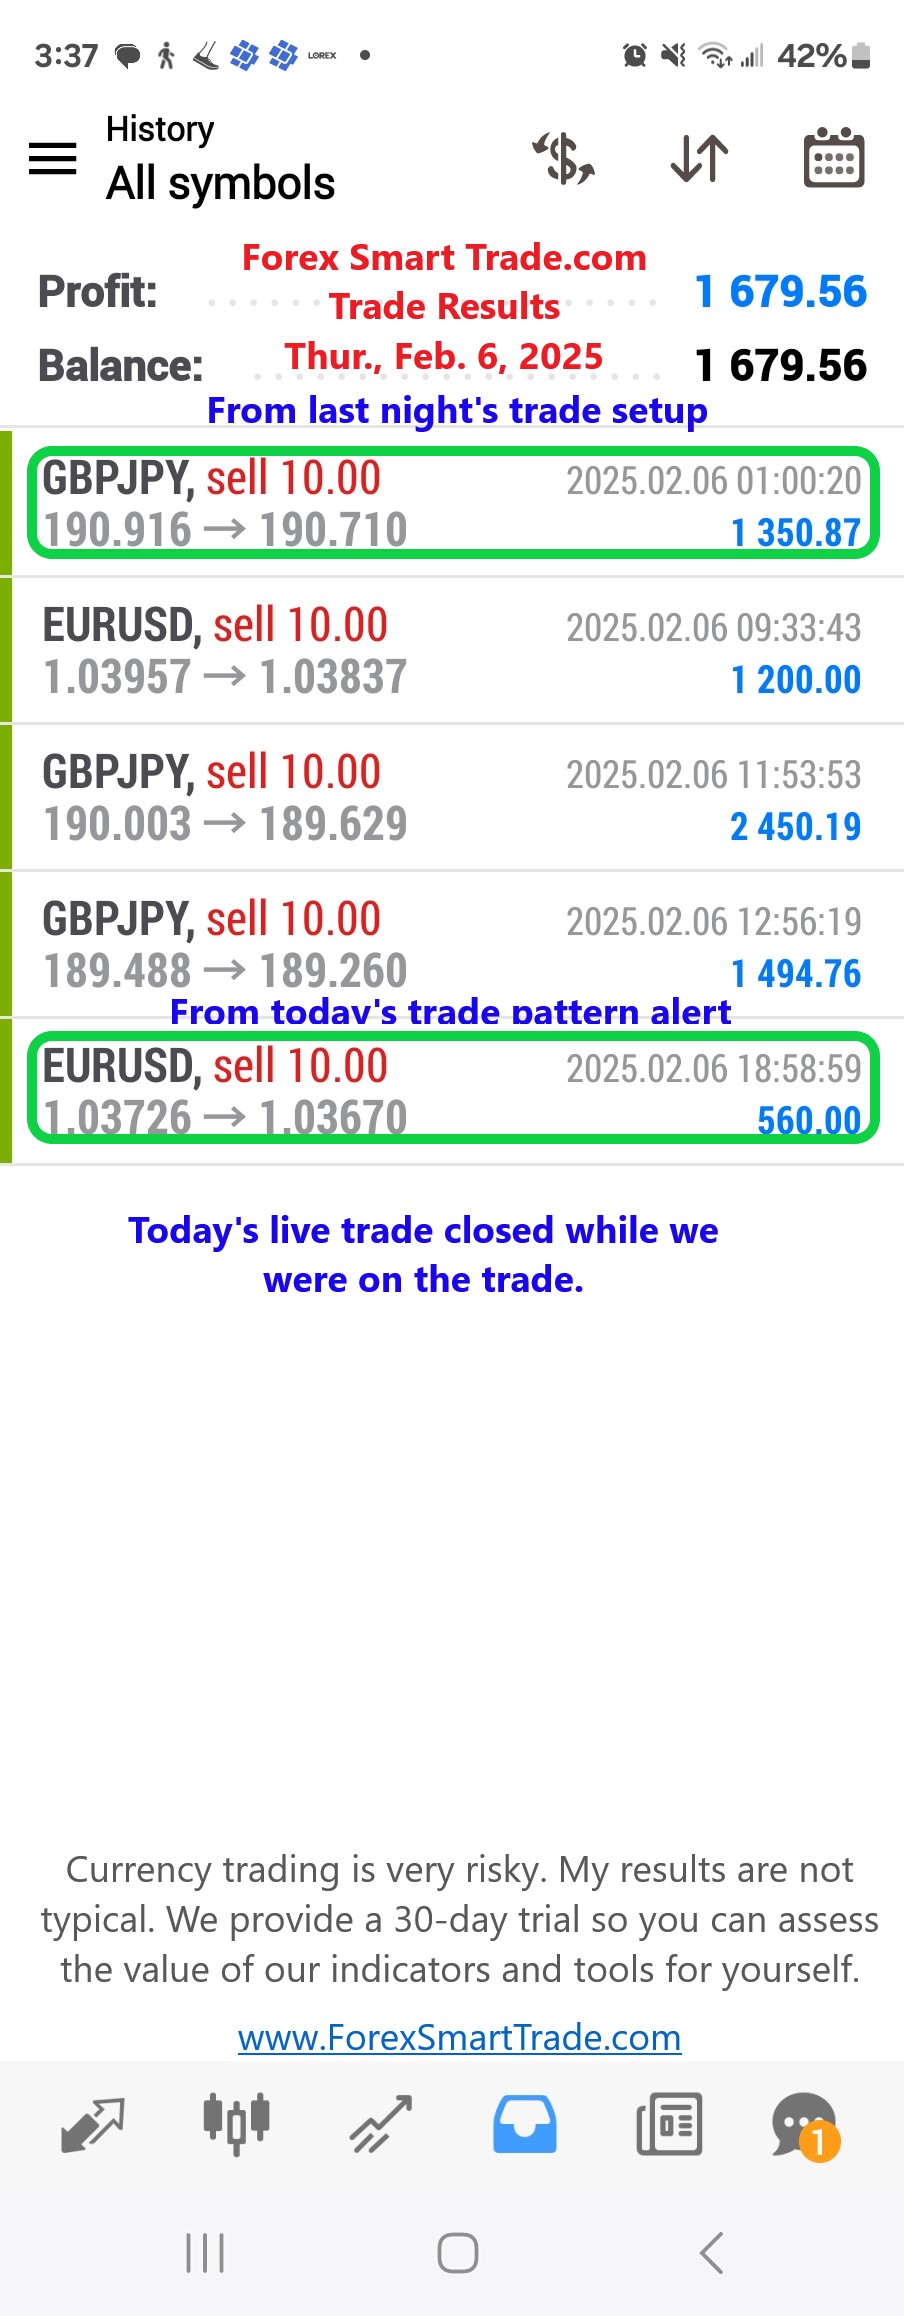
Forex Smart Trade Results, Thur., Feb. 6, 2025: $1,679
What If Fear Is the Only Thing Holding You Back? In the Roman Republic, Lucius Crassus was one of the greatest public speakers of his time. […]
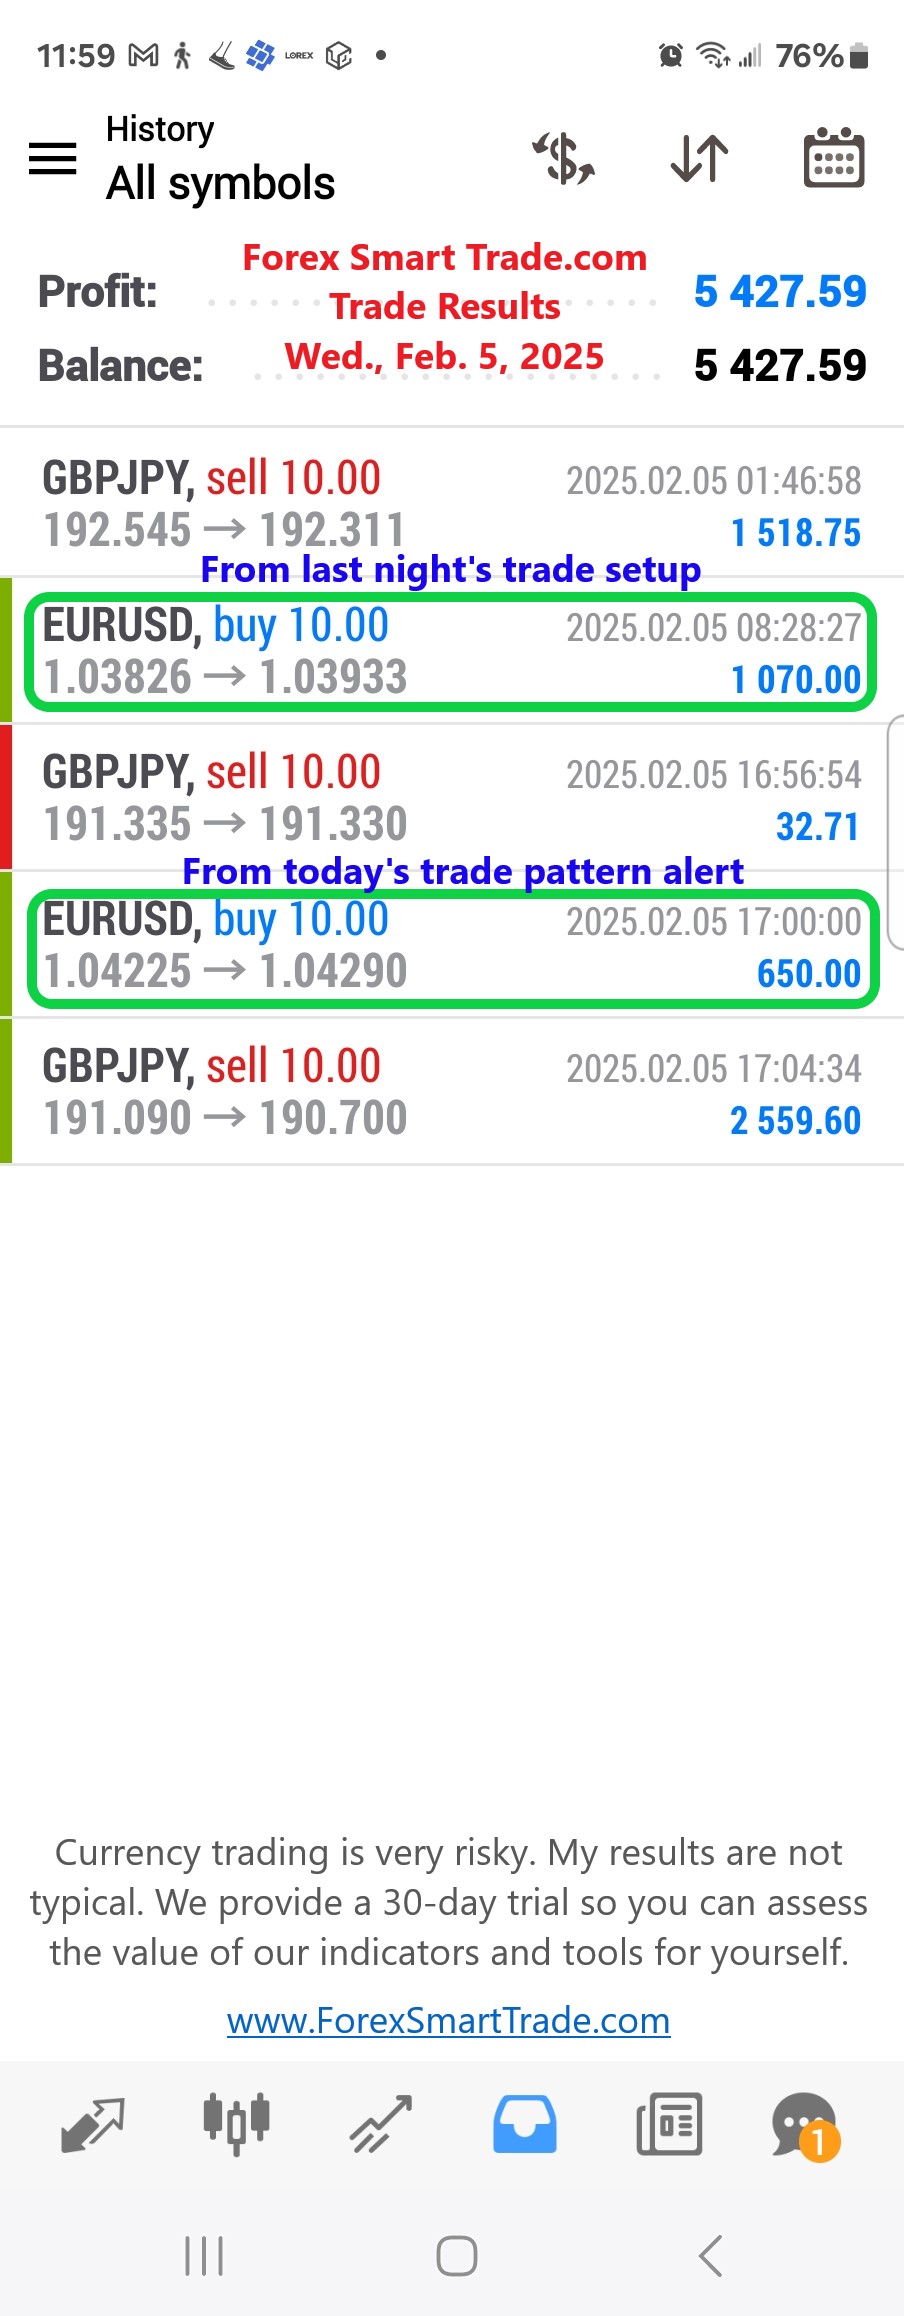
Forex Smart Trade Results, Wed., Feb. 5, 2025: $5,427
The Role You Choose to Play in Life… Epictetus once said: “Remember that thou art an actor in a play of such a kind as the […]
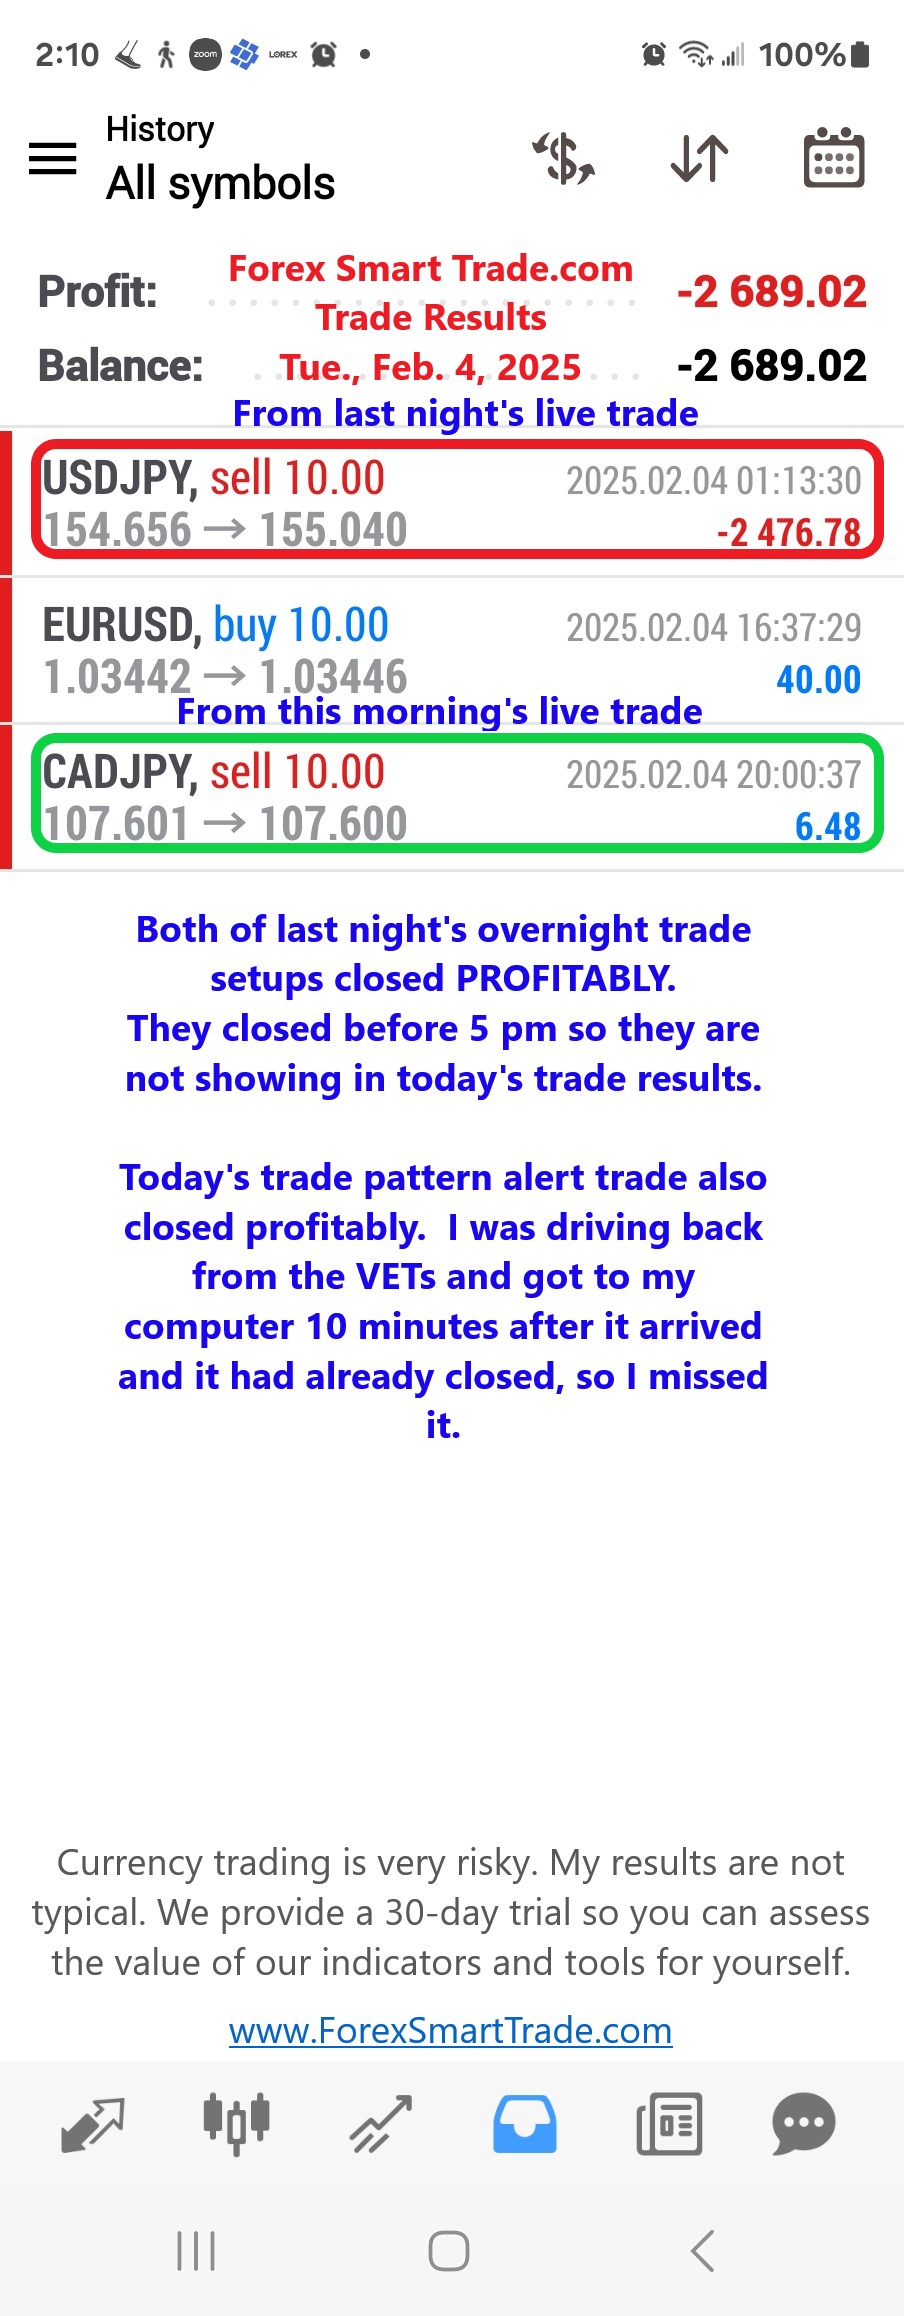
Forex Smart Trade Results, Tue., Feb. 4, 2025: ($2,689)
The Hard Truth About Your Trading Dreams. We all have things we want to change. Bad habits to break. Good habits to build. Goals that have […]
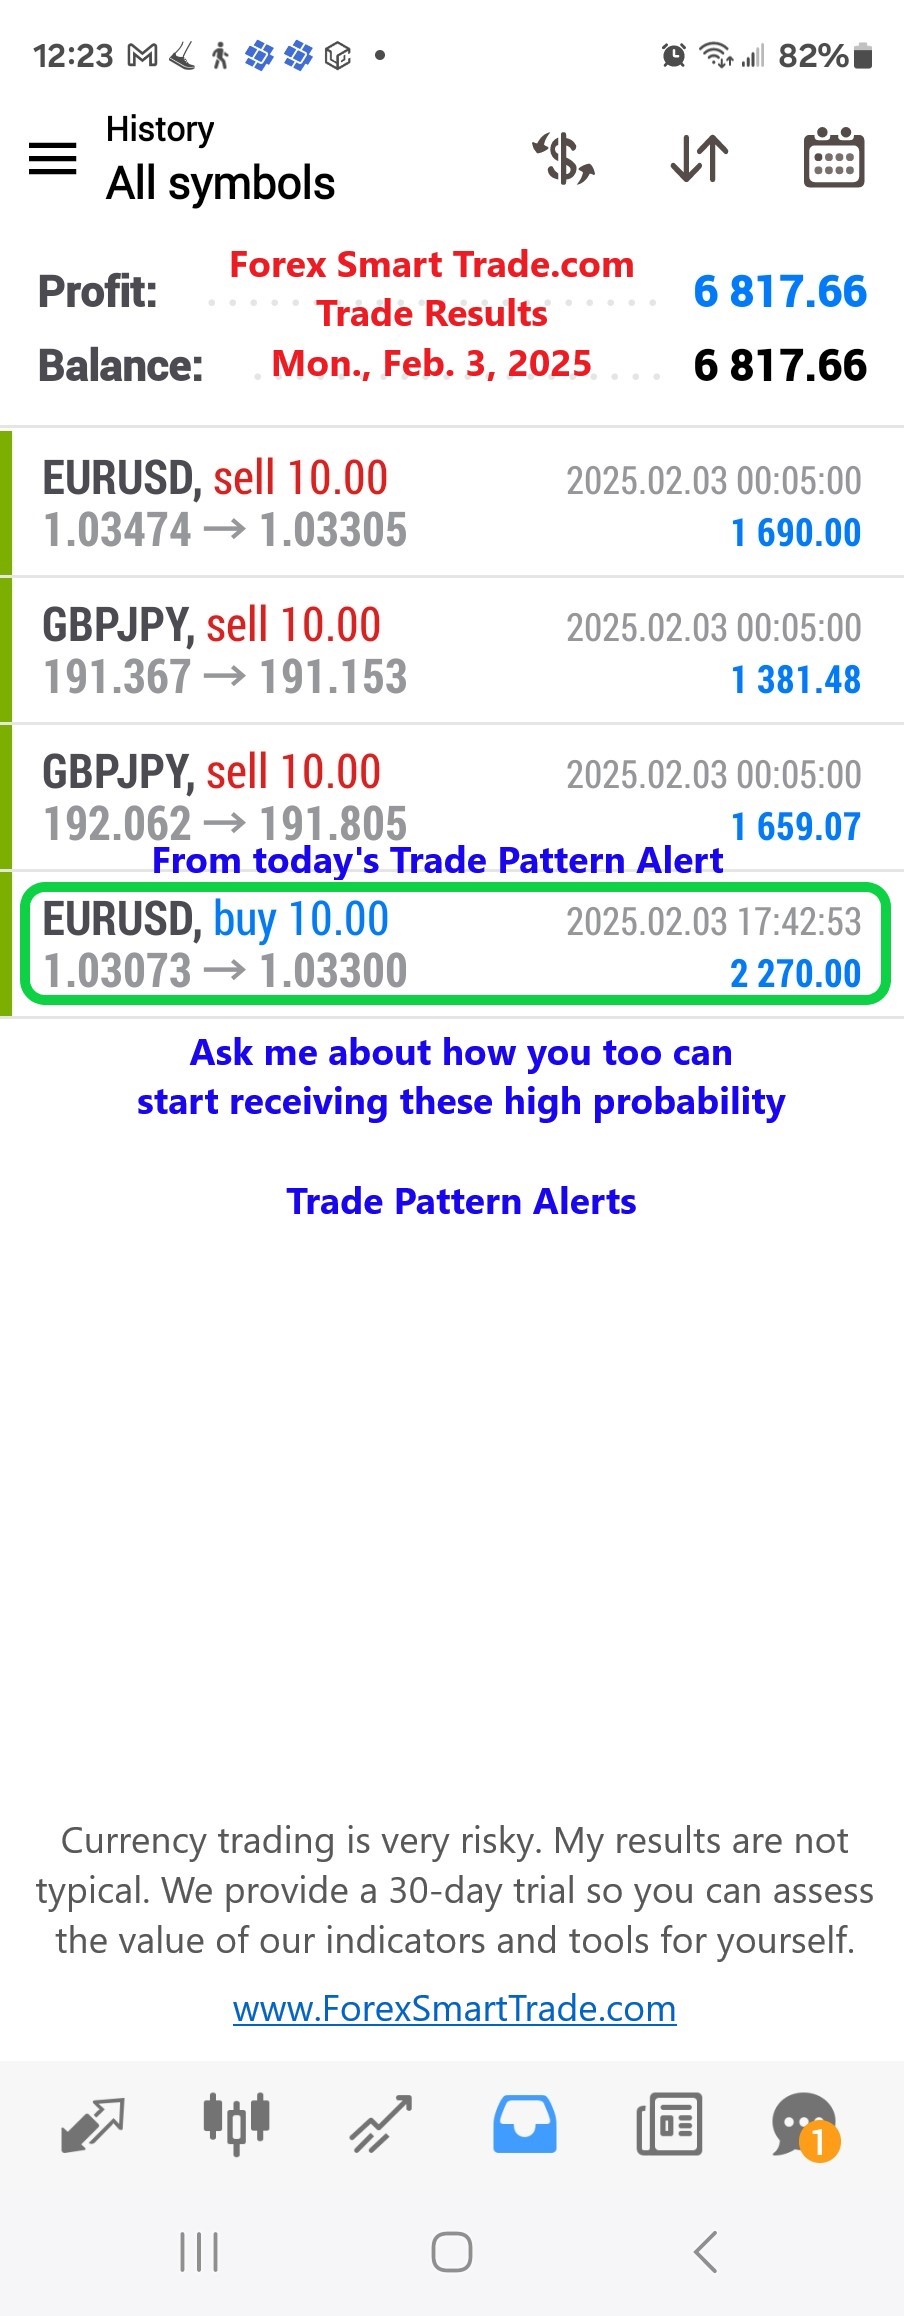
Forex Smart Trade Results, Mon. Feb. 3, 2025: $6,817
The One Asset Even Billionaires Can’t Buy Back. It feels like you have time. You’re young. You’re healthy. The future is bright. But that feeling won’t […]

Forex Smart Trade Results, Fri., Jan. 31, 2025 – $1,050
What Time Frame Should You Trade? What time frame should you trade your system on? The smaller the timeframe, the more difficult it is to develop […]

Forex Smart Trade Results, Thur., Jan. 30, 2025: $4,307
When Edmund Hillary Reached Everest’s Peak, He Didn’t Look Down. He Looked for His Next Mountain. What’s your next mountain to climb? Think about it — […]

Forex Smart Trade Results, Wed., Jan. 29, 2025: $5,303
The Secret to Success? A Plan You Actually Believe In. I’ve been diving into Principles by Ray Dalio, the billionaire investor behind Bridgewater Associates, the largest […]