Trade Results
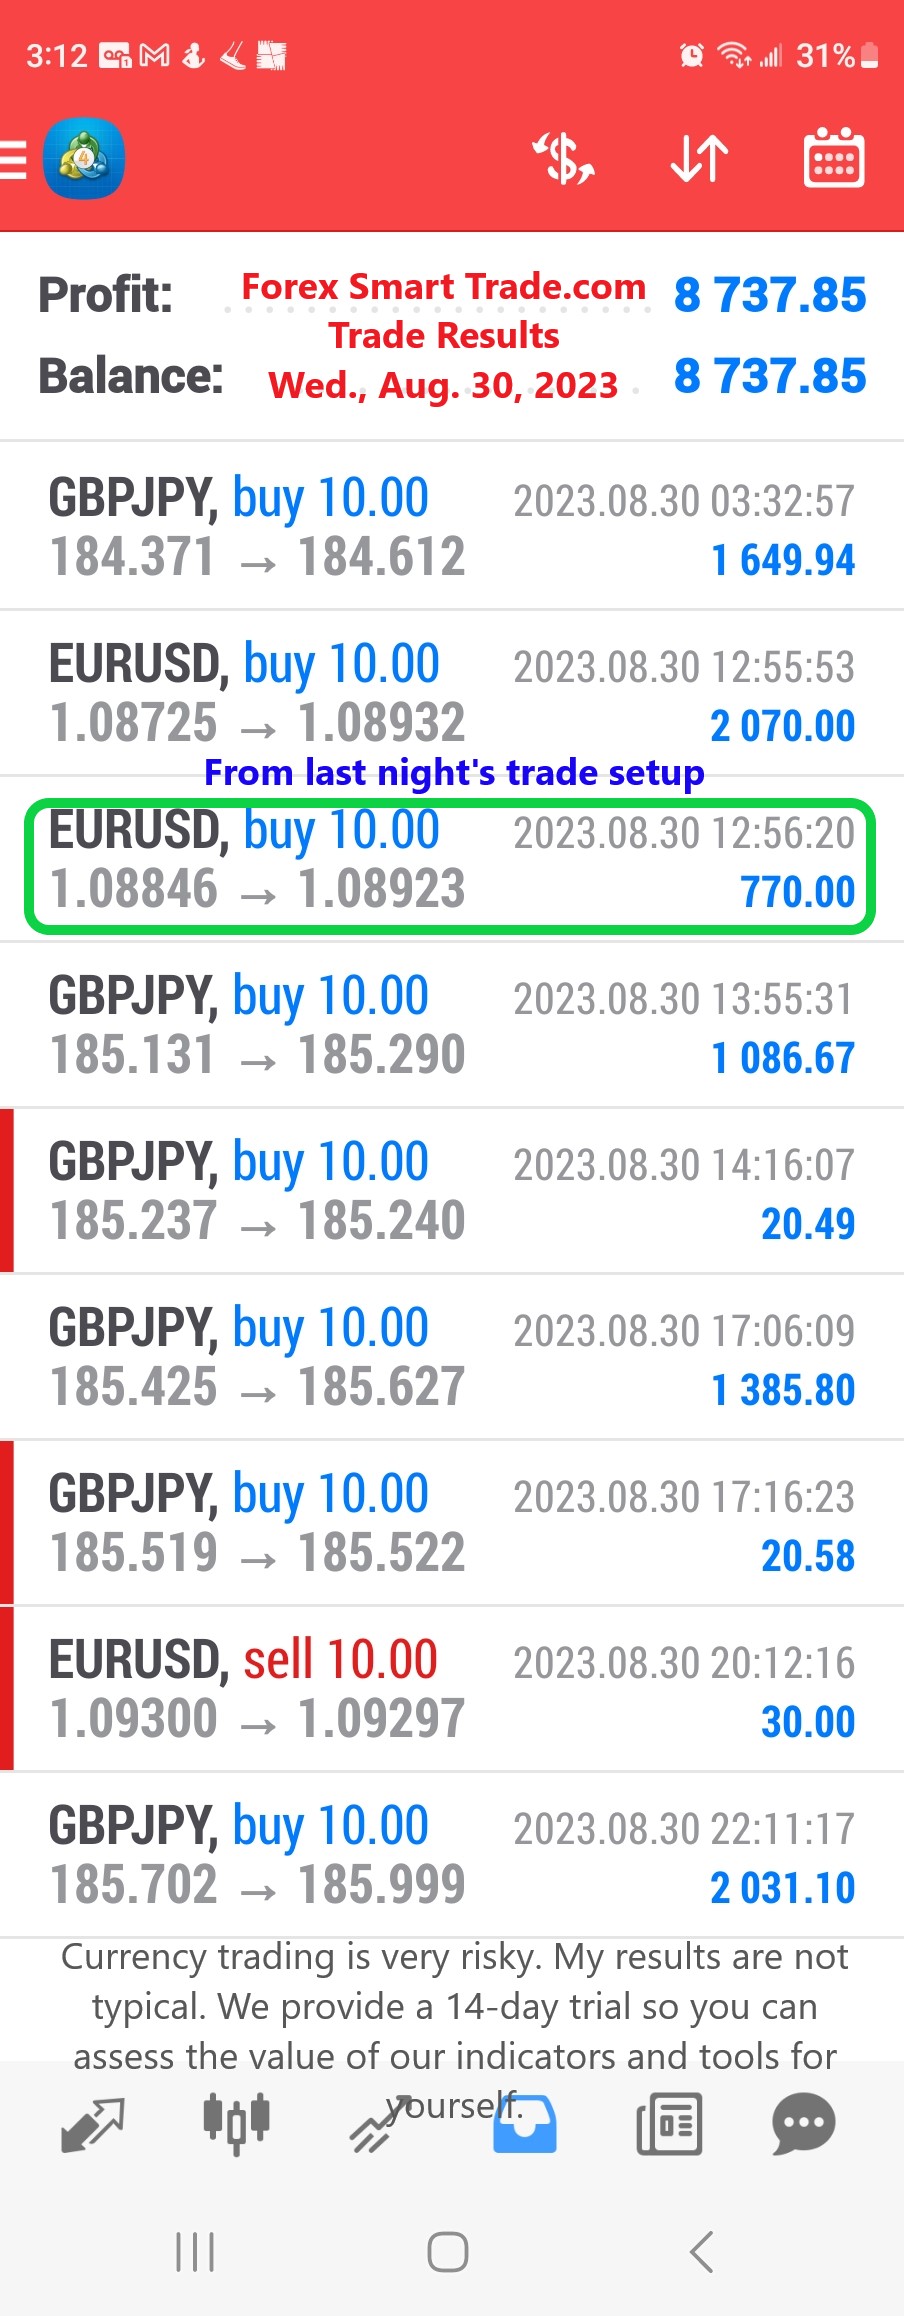
Forex Smart Trade Results, Wednesday, August 30, 2023 – $8,737
How to Use Pivot Points to Measure Market Sentiment. Let’s look at how to use pivot points to measure market sentiment. There is one other way […]
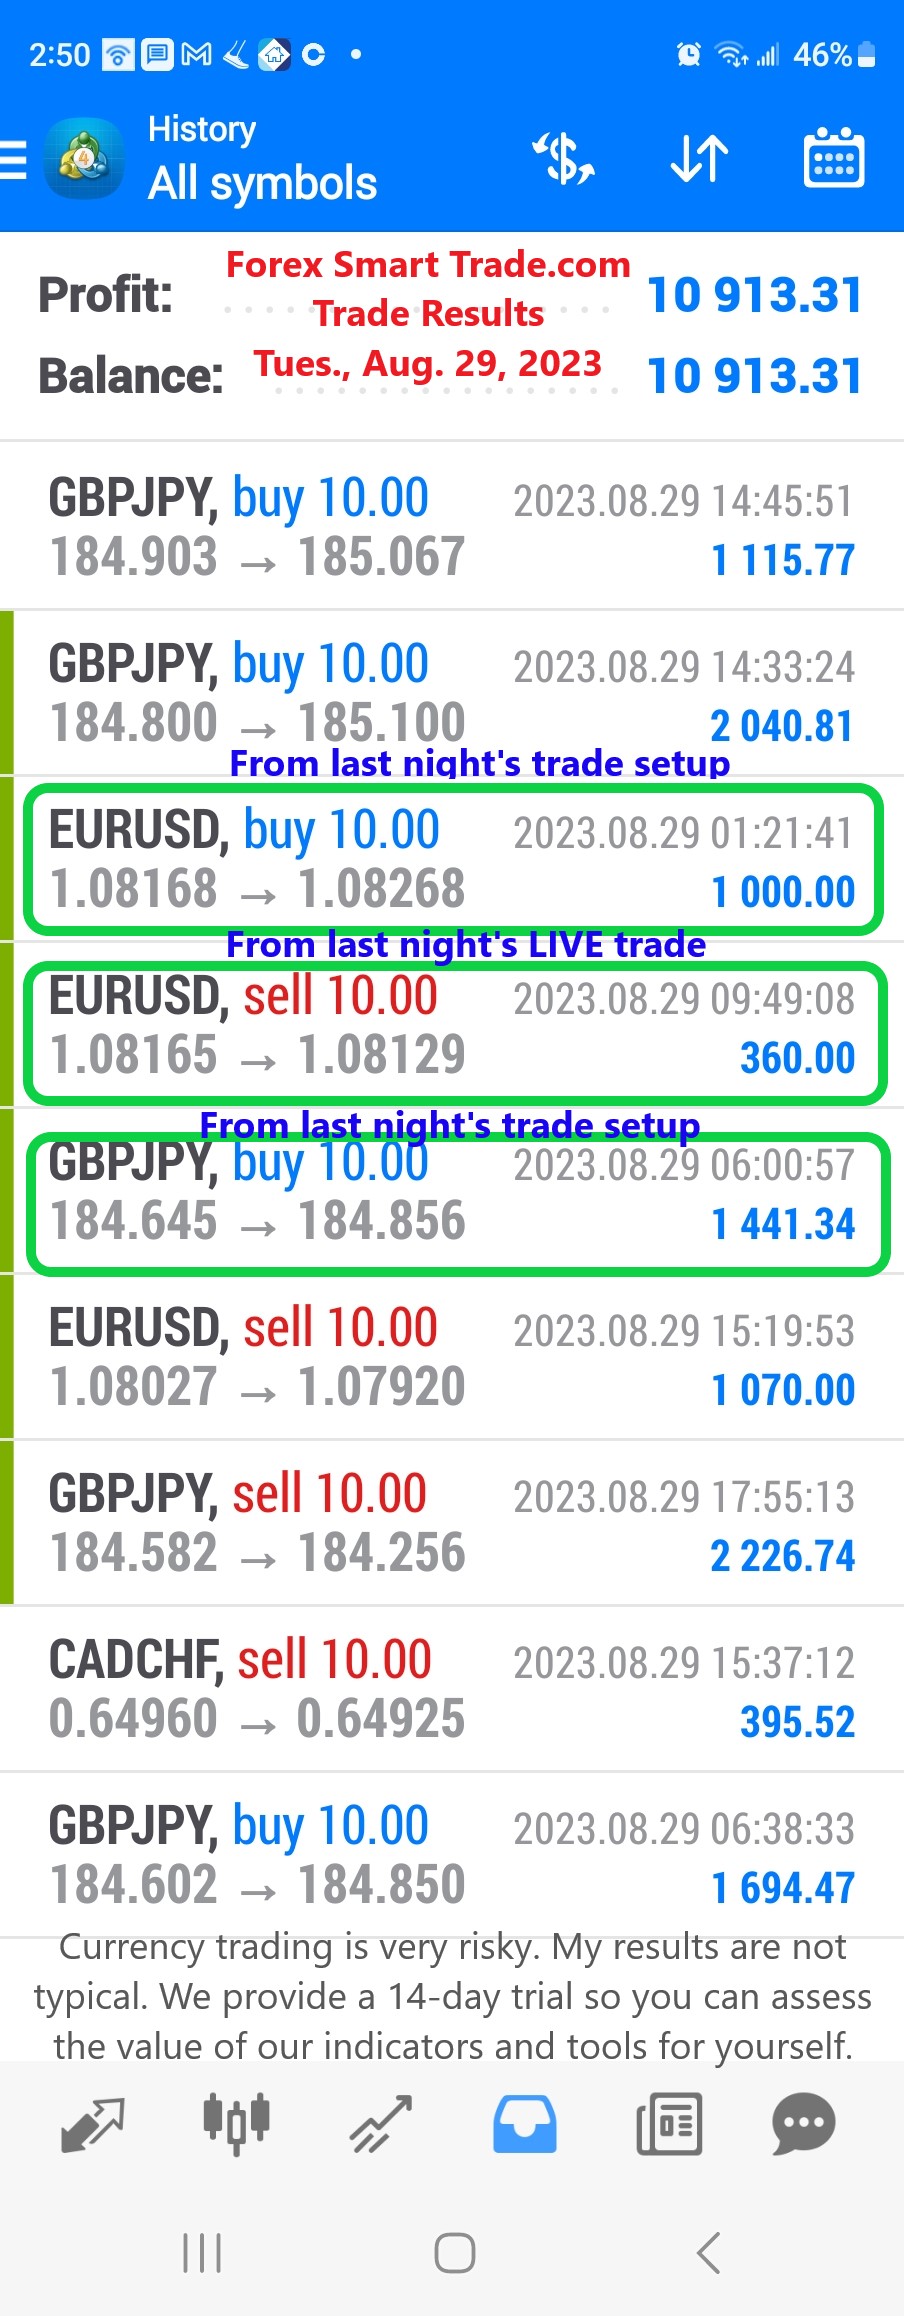
Forex Smart Trade Results, Tuesday, August 29, 2023 – $10,913
Pivot Points Trade Breakout “Role Reversal.” Let’s look at the pivot points trade breakout role reversal. Remember that, when support levels break, they usually turn into […]

Forex Smart Trade Results, Monday, August 28, 2023 – $1,524
How to Use Pivot Points to Trade Breakouts. Just like your normal support and resistance levels, pivot point levels won’t hold forever. Using pivot points for […]
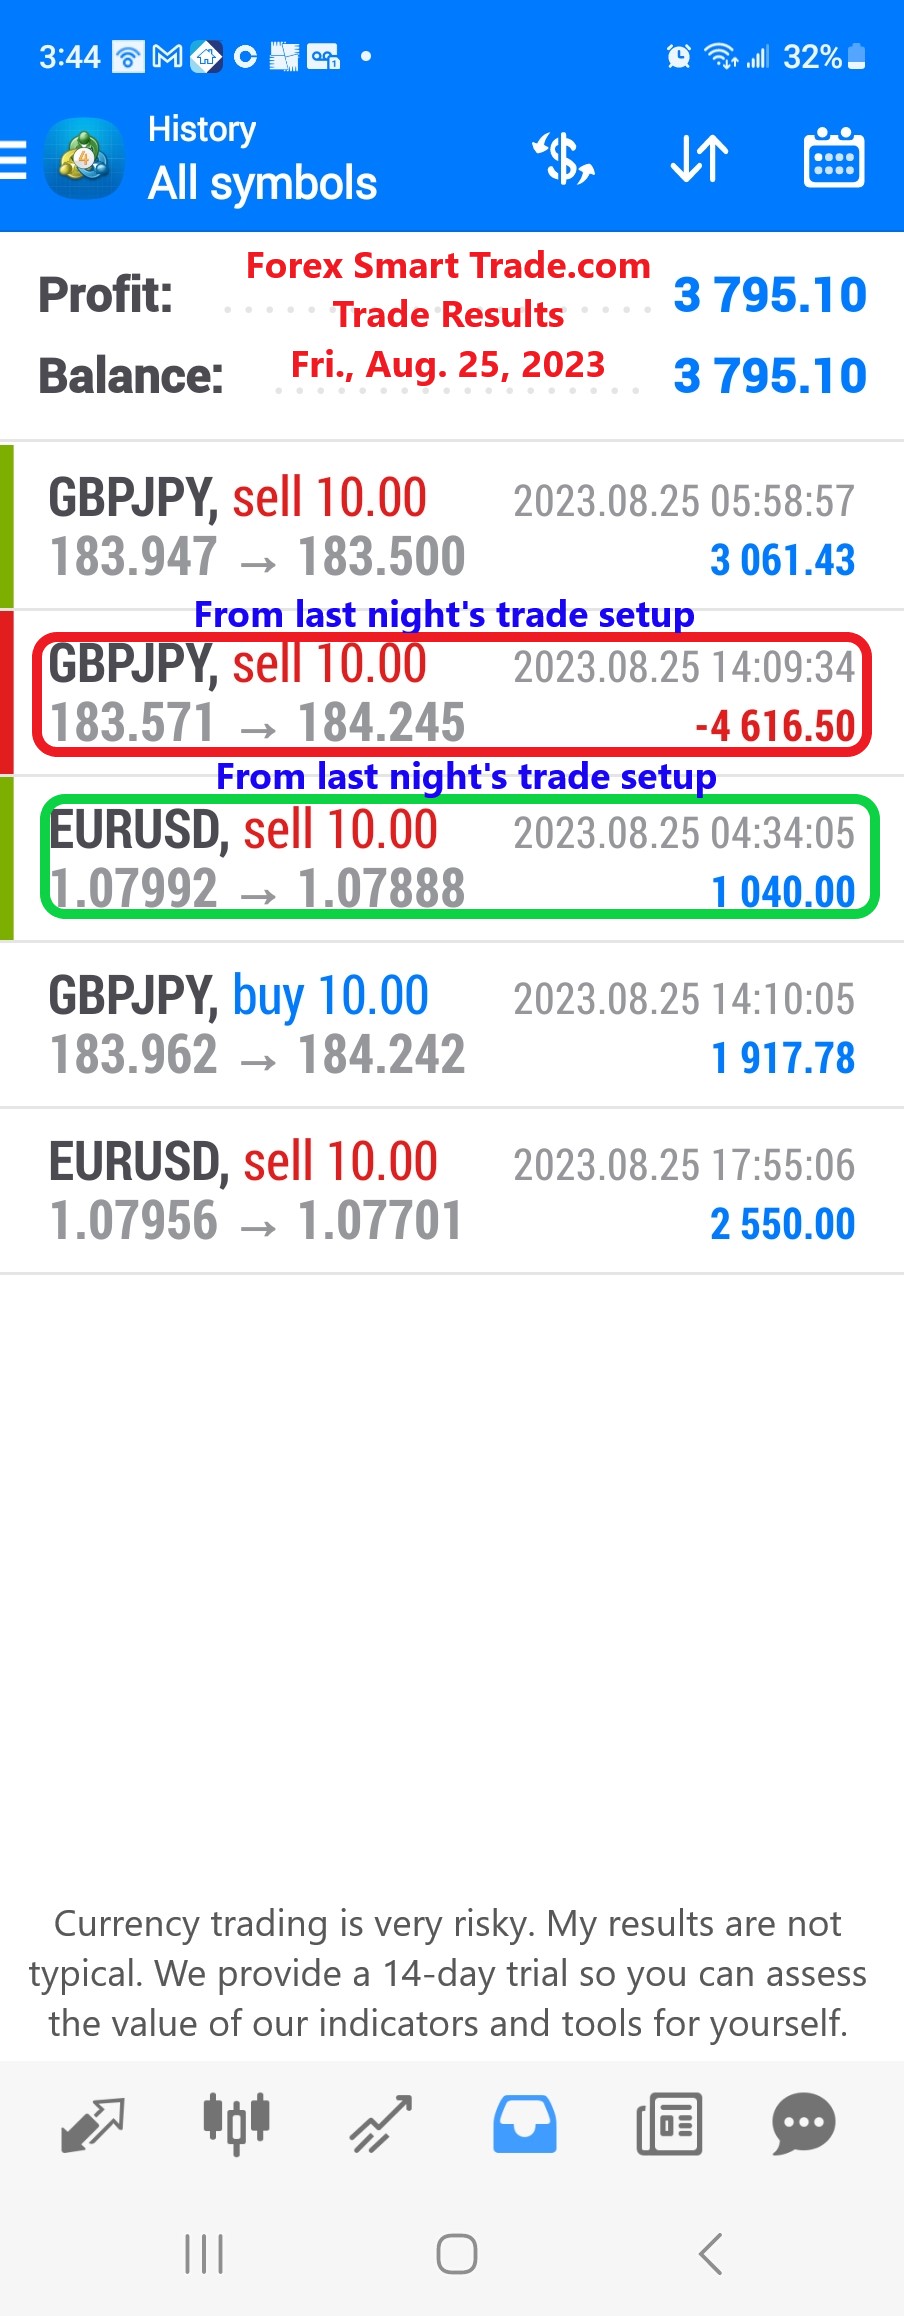
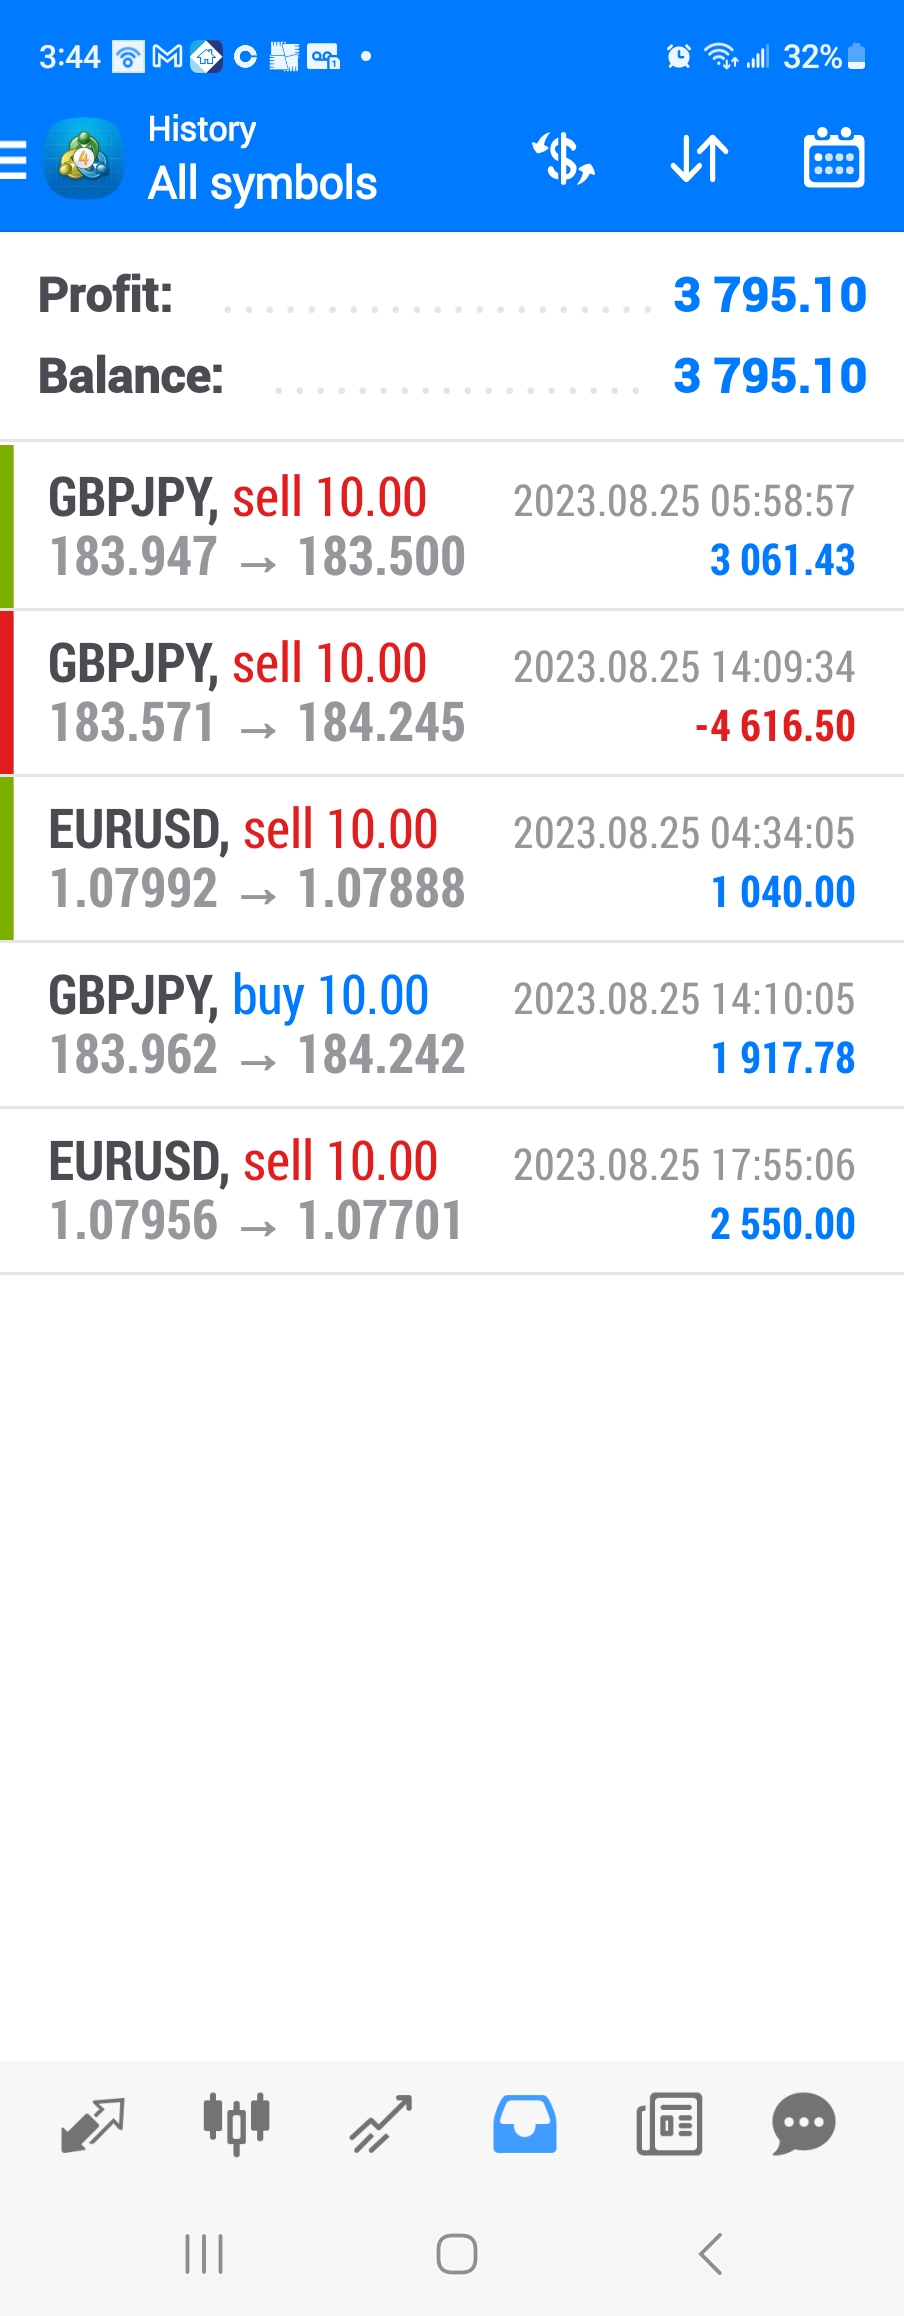
Forex Smart Trade Results, Friday, August 25, 2023 – $3,795
Range Trading with Pivot Points. Let’s continue our example from yesterday on range trading with pivot points. As for your take-profit points, you could target PP […]
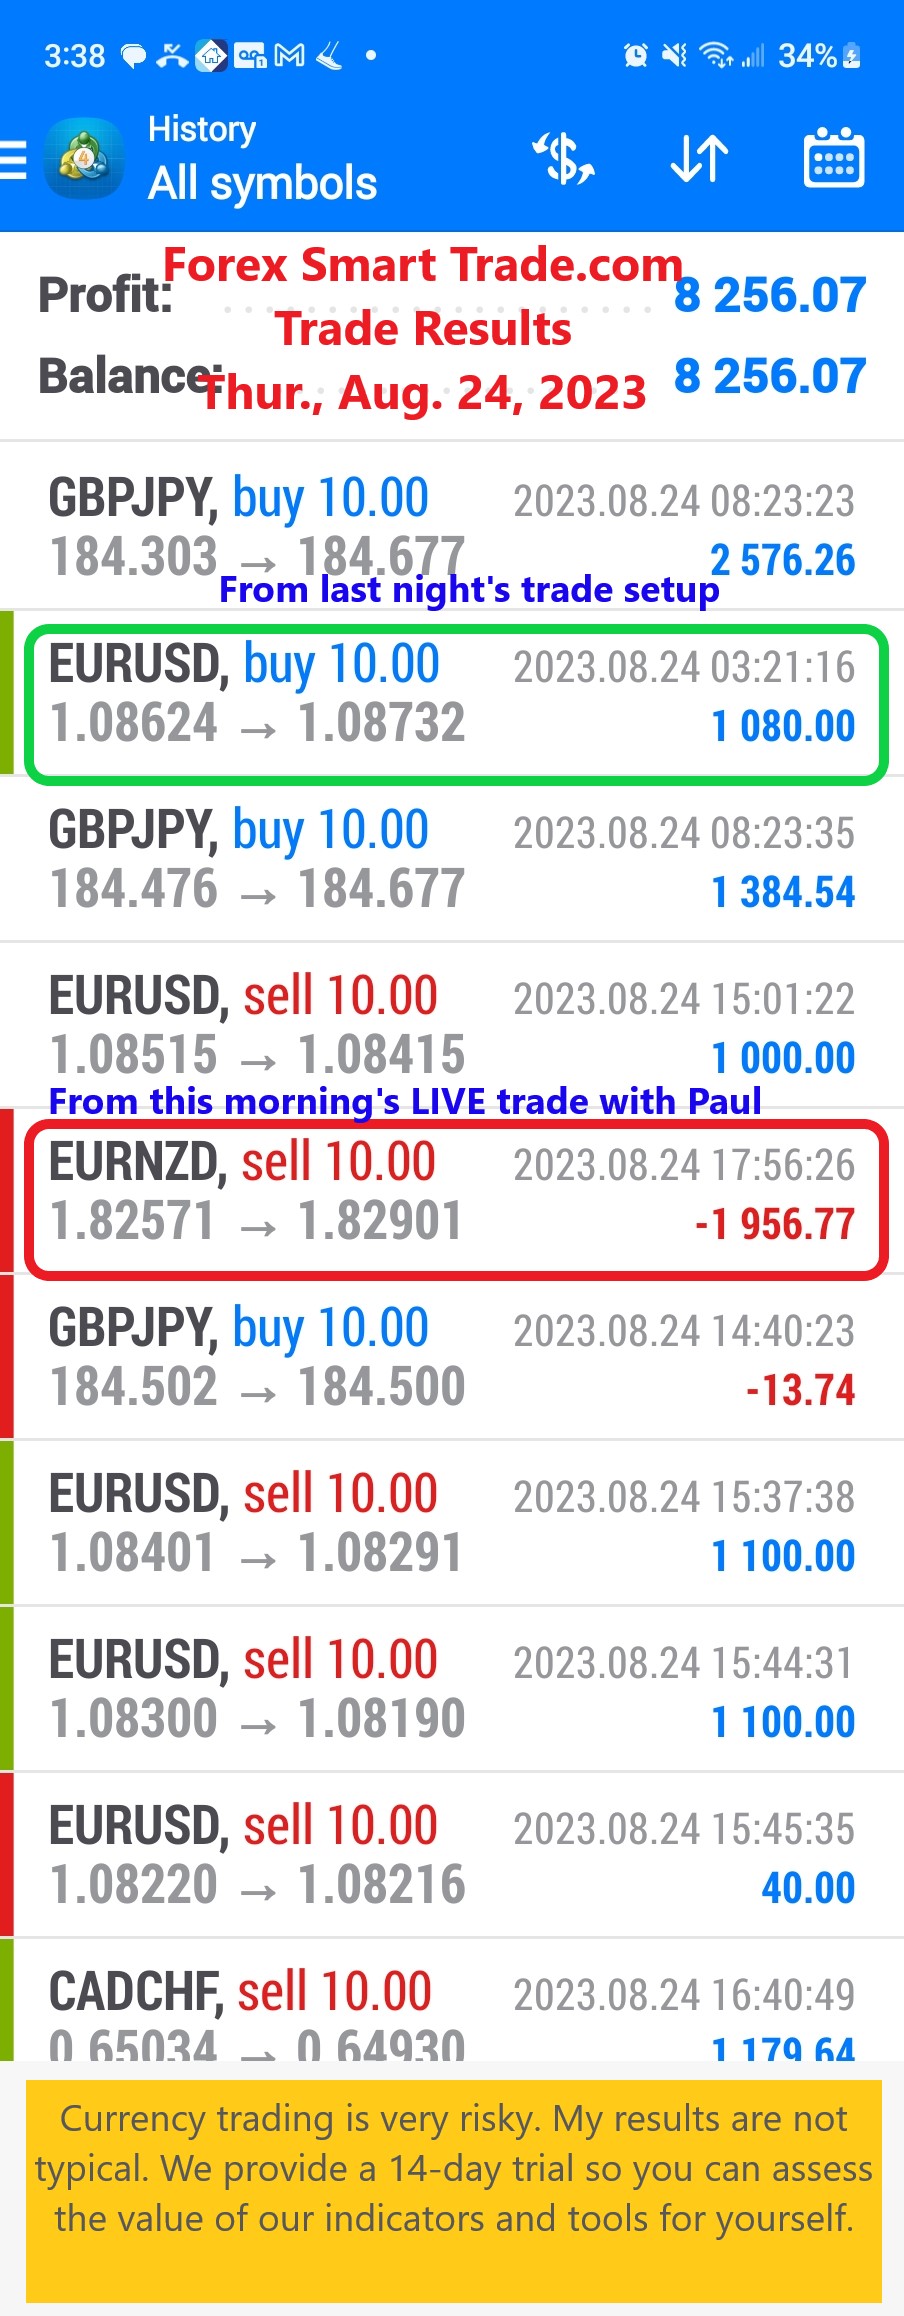
Forex Smart Trade Results, Thursday, August 24, 2023 – $8,256
Range Trading with Pivot Points. Let’s examine range trading with pivot points. The simplest way to use pivot point levels in your forex trading is to use […]
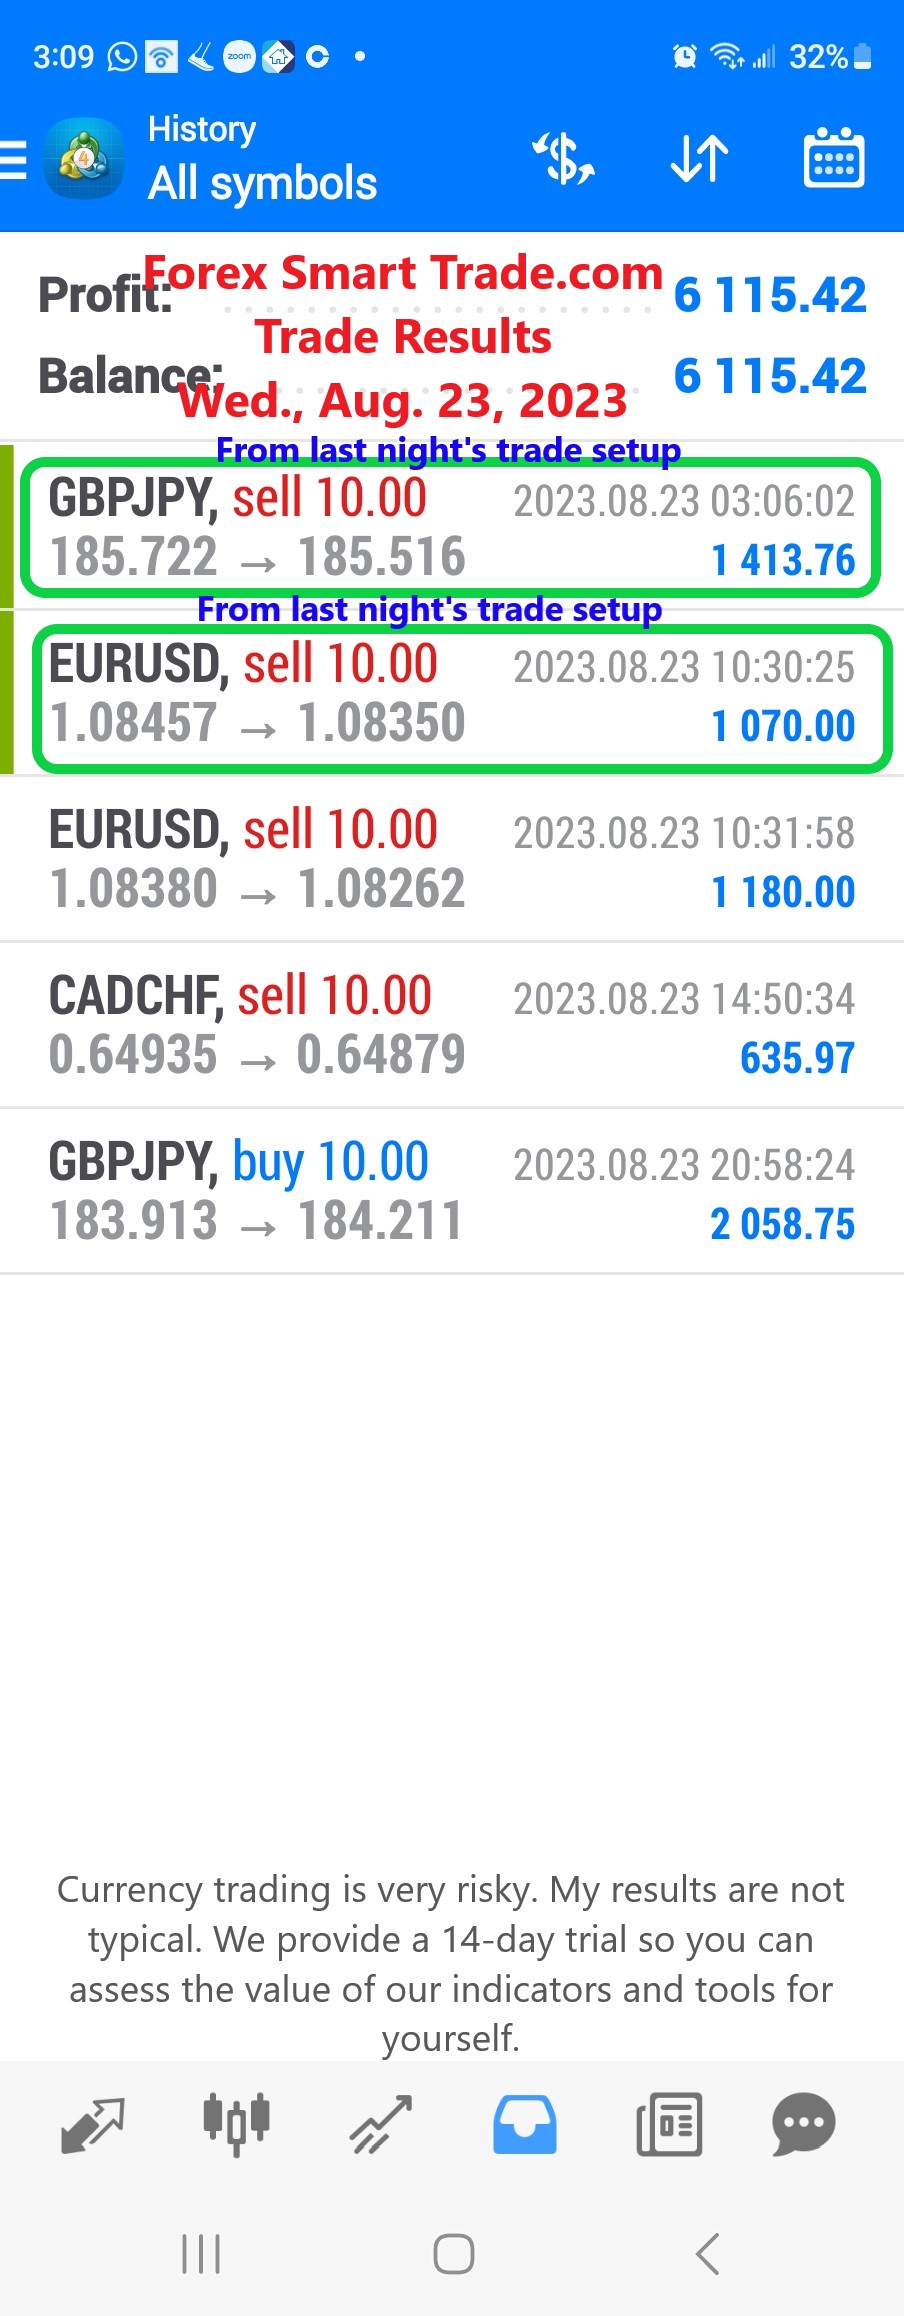
Forex Smart Trade Results, Wednesday, August 23, 2023 – $6,115
How to Calculate Pivot Points. Let’s take a look at how to calculate pivot points. The first thing you’re going to learn is how to calculate […]
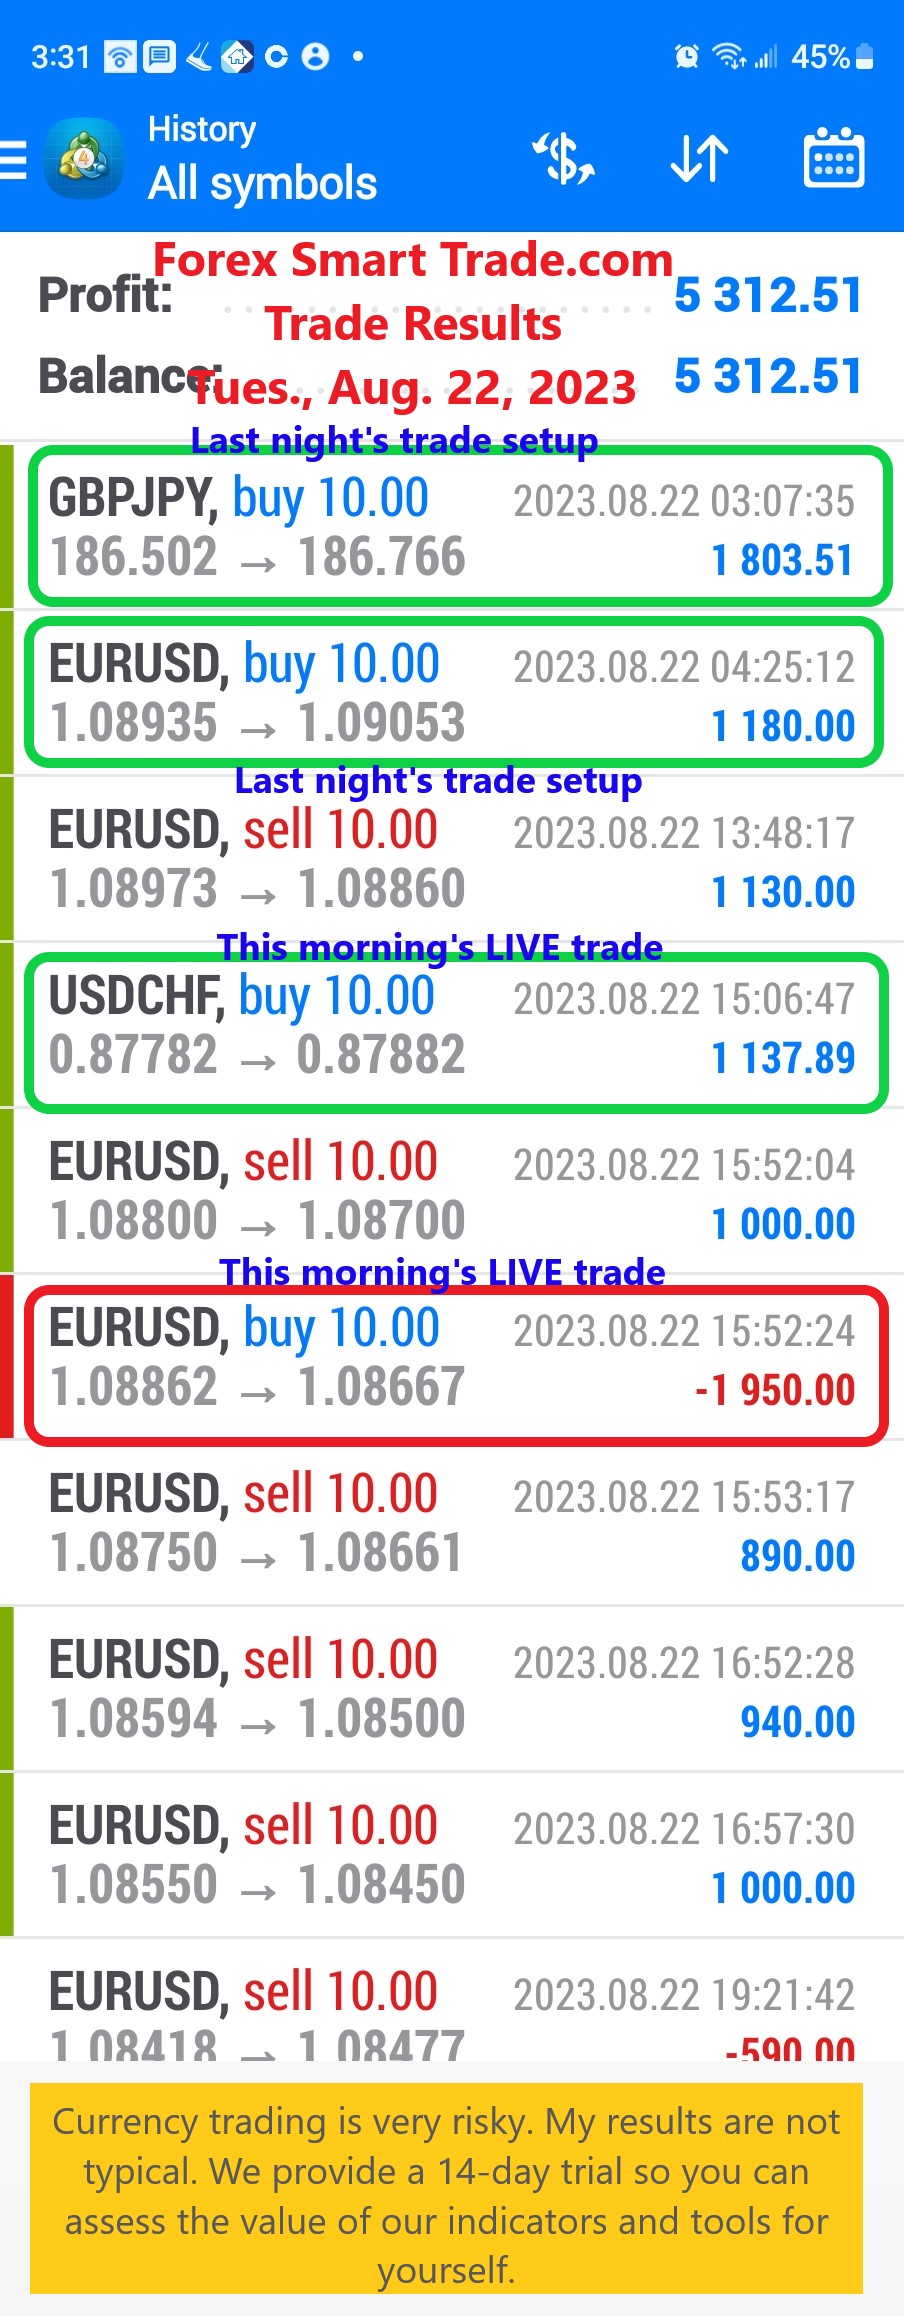
Forex Smart Trade Results, Tuesday, August 22, 2023 – $5,312
What Are Pivot Points? What are pivot points (PP)? Professional traders and market makers use pivot points to identify potential support and resistance levels. Simply put, they are […]
Forex Smart Trade Results, Monday, August 21, 2023 – $3,086
Chart Patterns Cheat Sheet. I am now going to give you a chart patterns cheat sheet. It is a neat little cheat sheet to help you […]
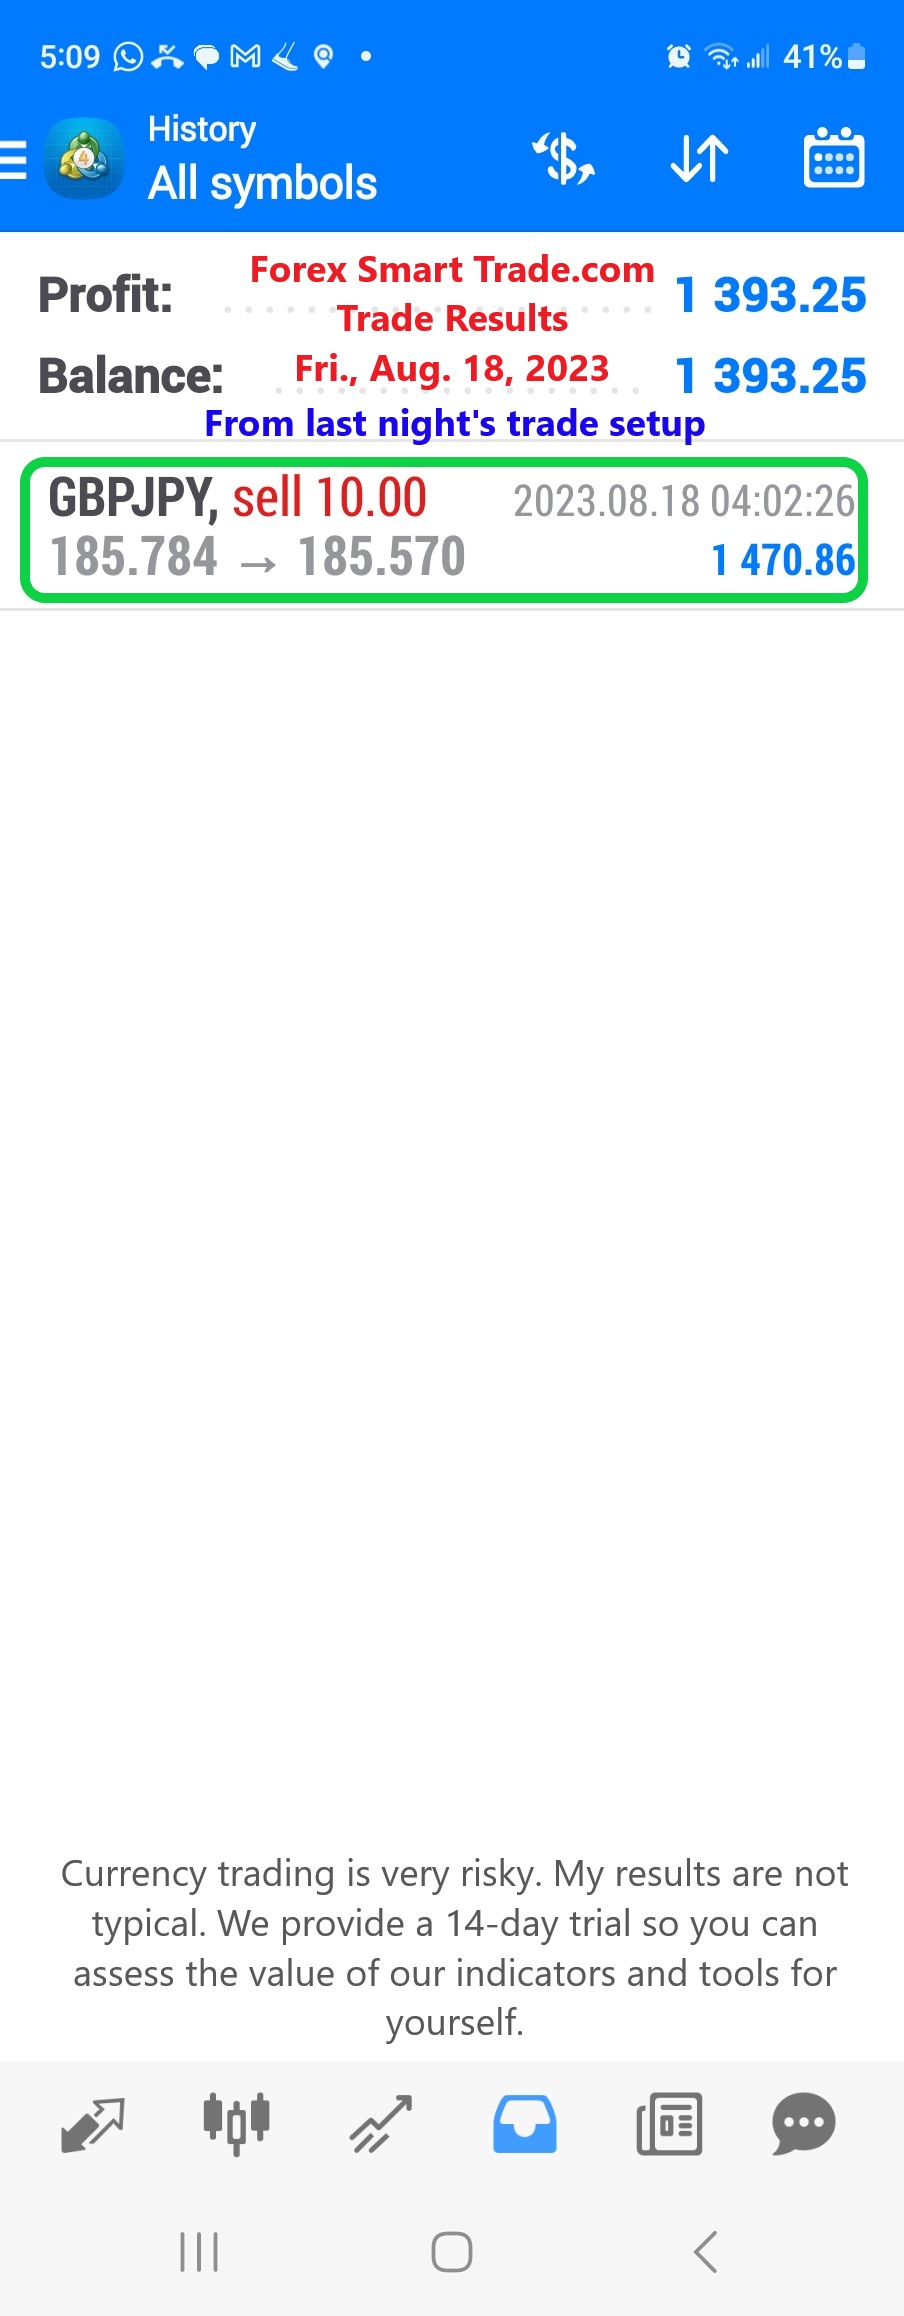
Forex Smart Trade Results, Friday, August 18, 2023 – $1,393
Bilateral Chart Patterns. Bilateral chart patterns are a bit more tricky because these signal that the price can move EITHER way. Huh? What kind of a signal […]
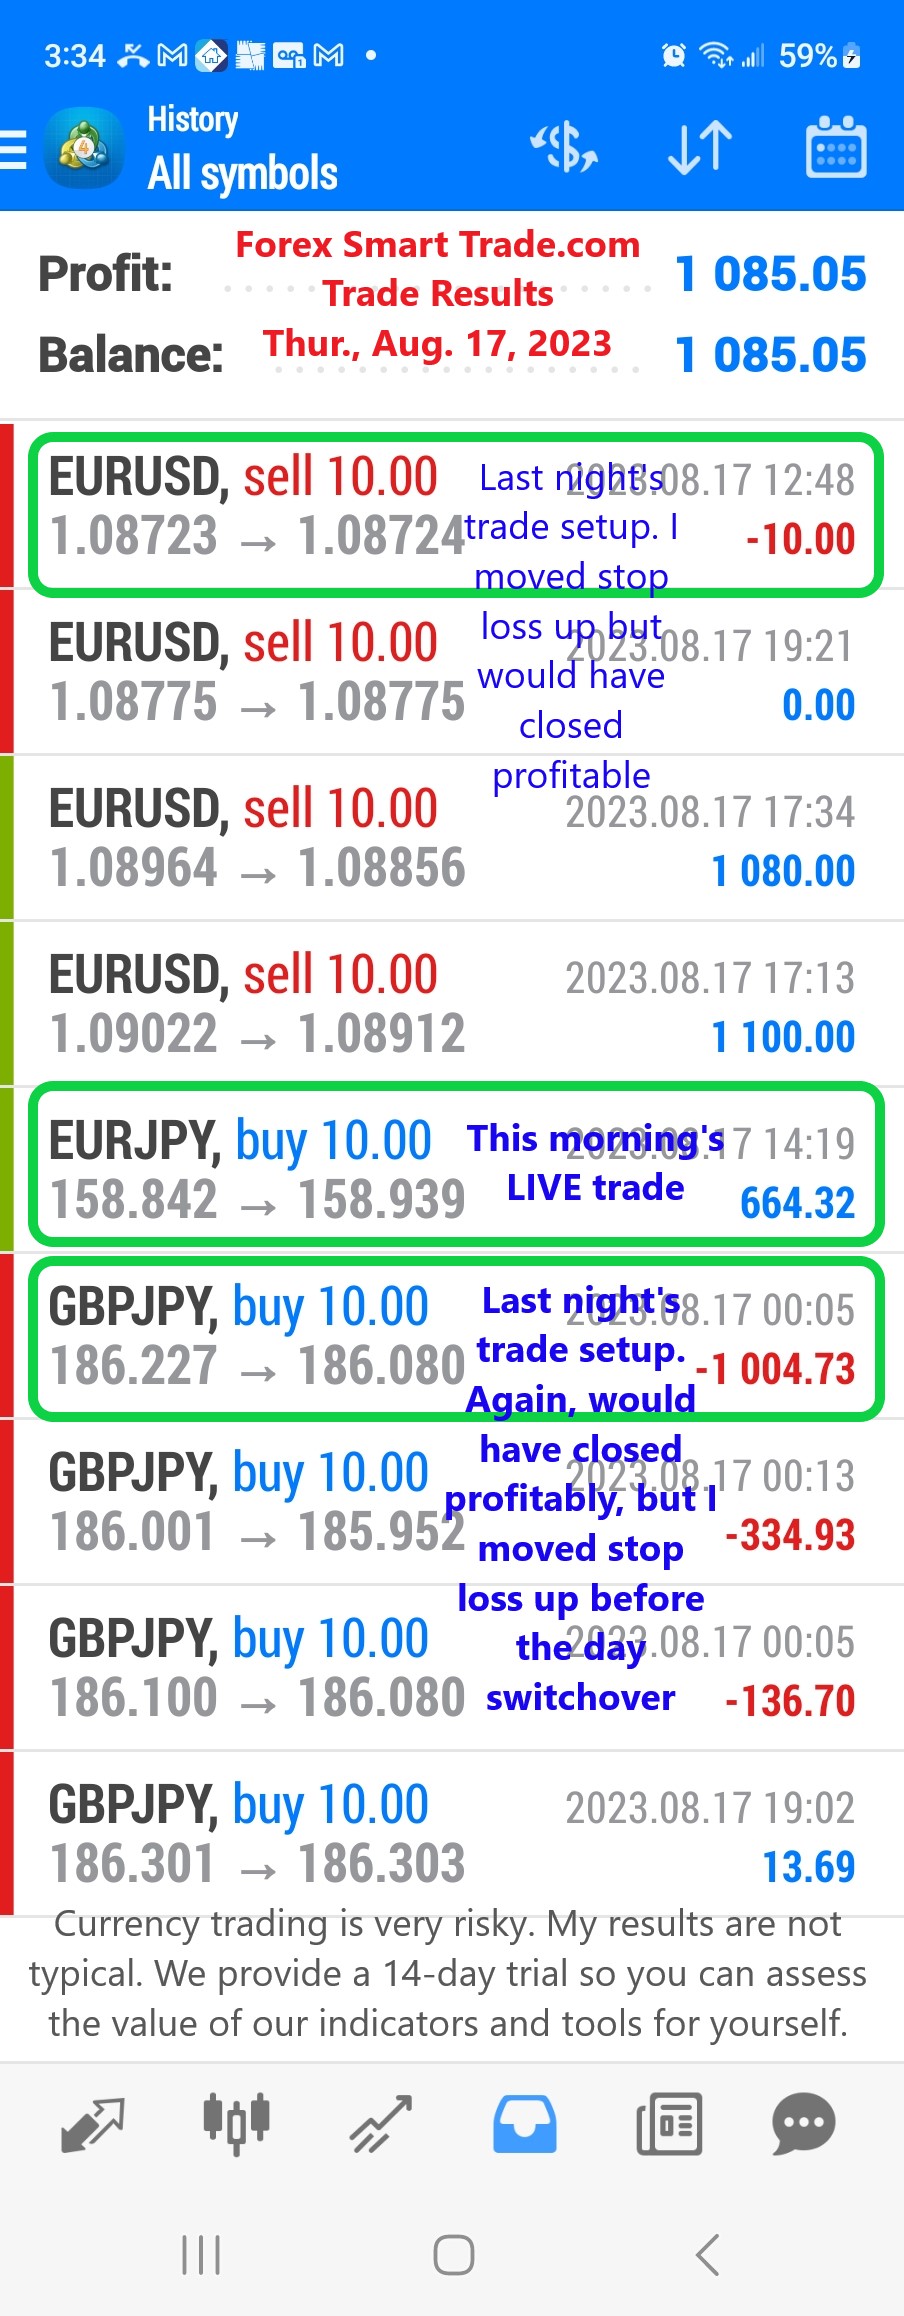
Forex Smart Trade Results, Thursday, August 17, 2023 – $1,085
Continuation Chart Patterns. Let’s look at continuation chart patterns. These chart patterns are those chart formations that signal that the ongoing trend will resume. Usually, these are […]
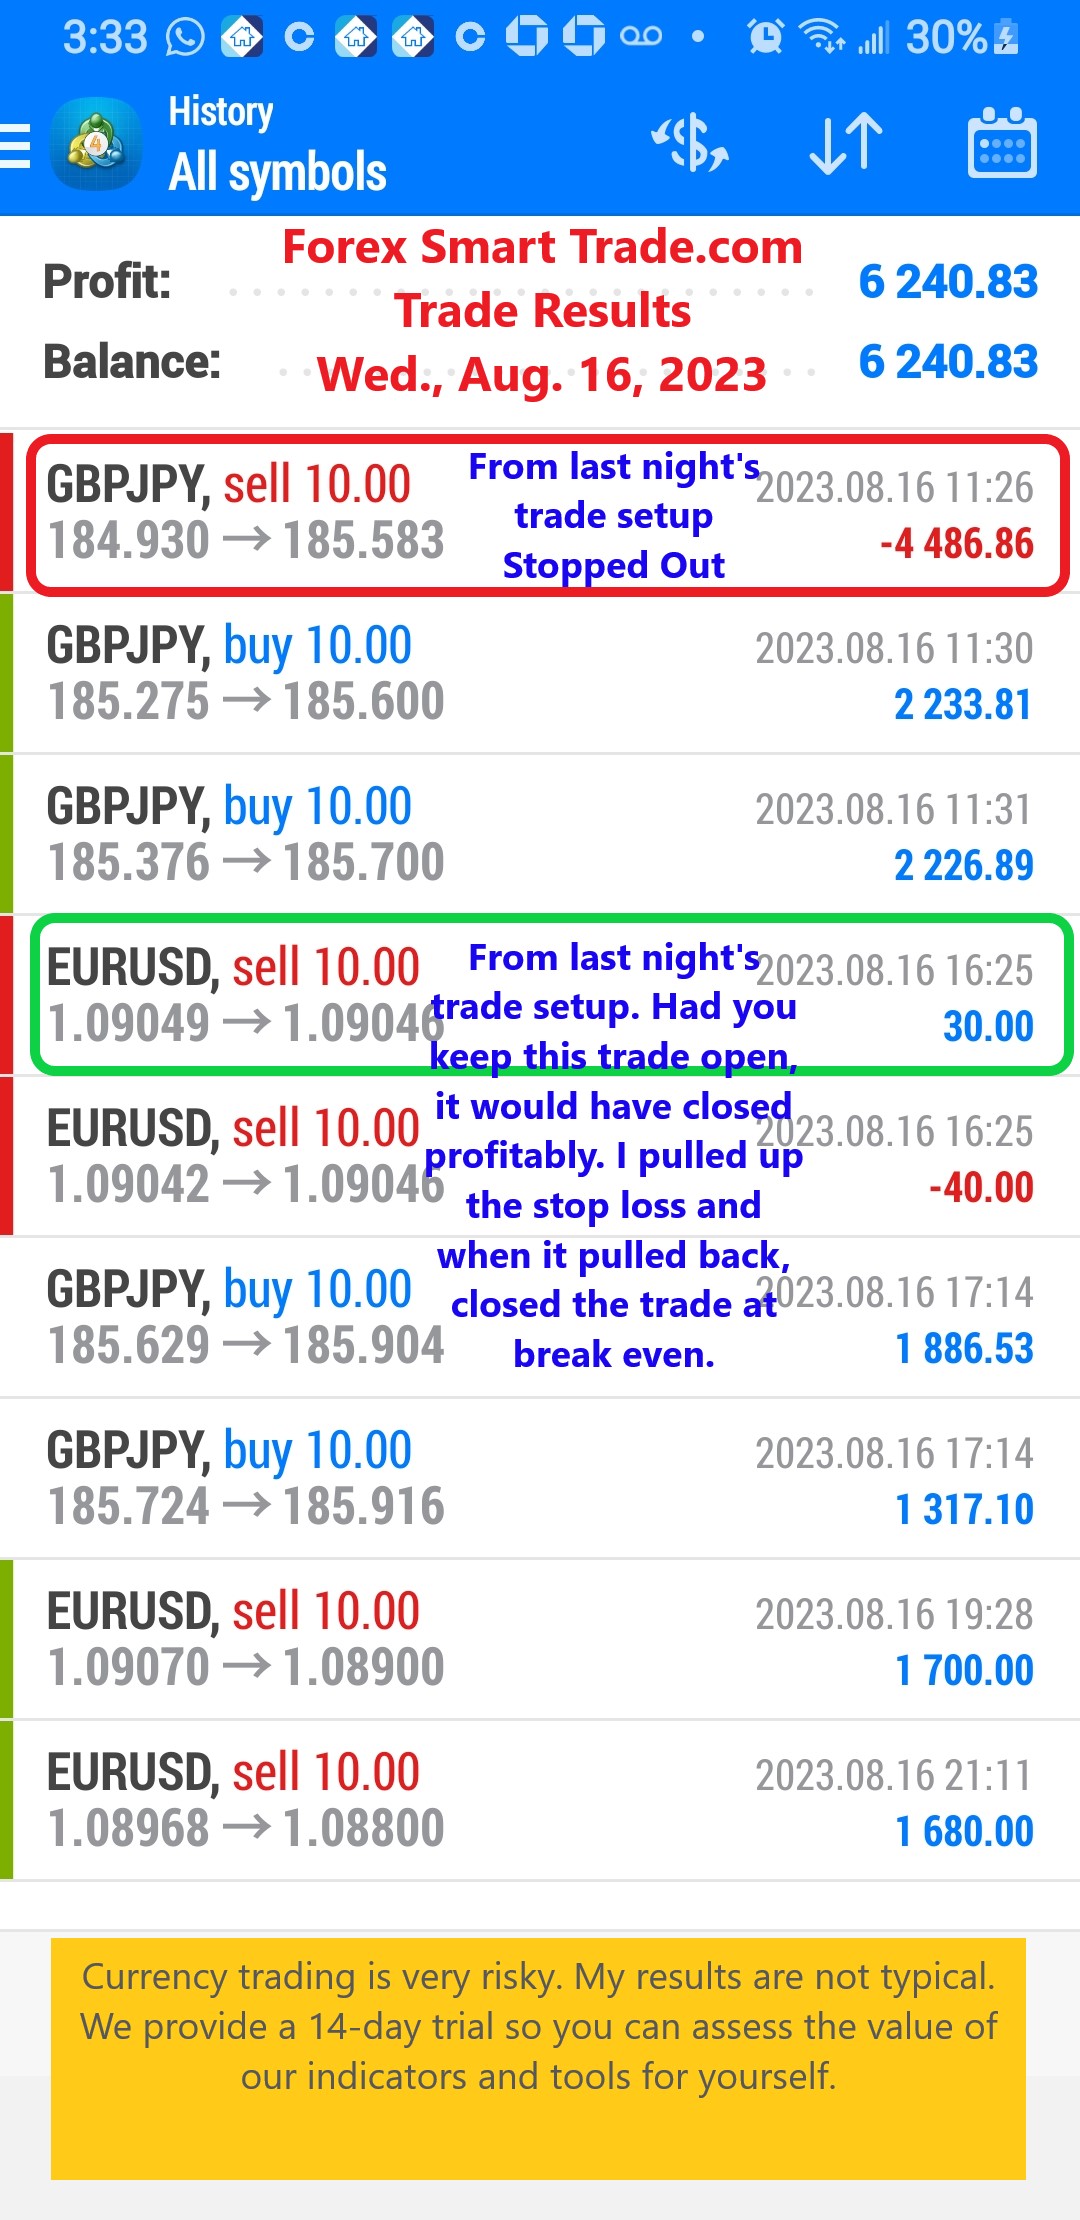
Forex Smart Trade Results, Wednesday, August 16, 2023 – $6,240
The 3 Main Groups of Chart Patterns. Let’s examine the 3 main groups of chart patterns. In this section, we’ll discuss a bit more about how […]
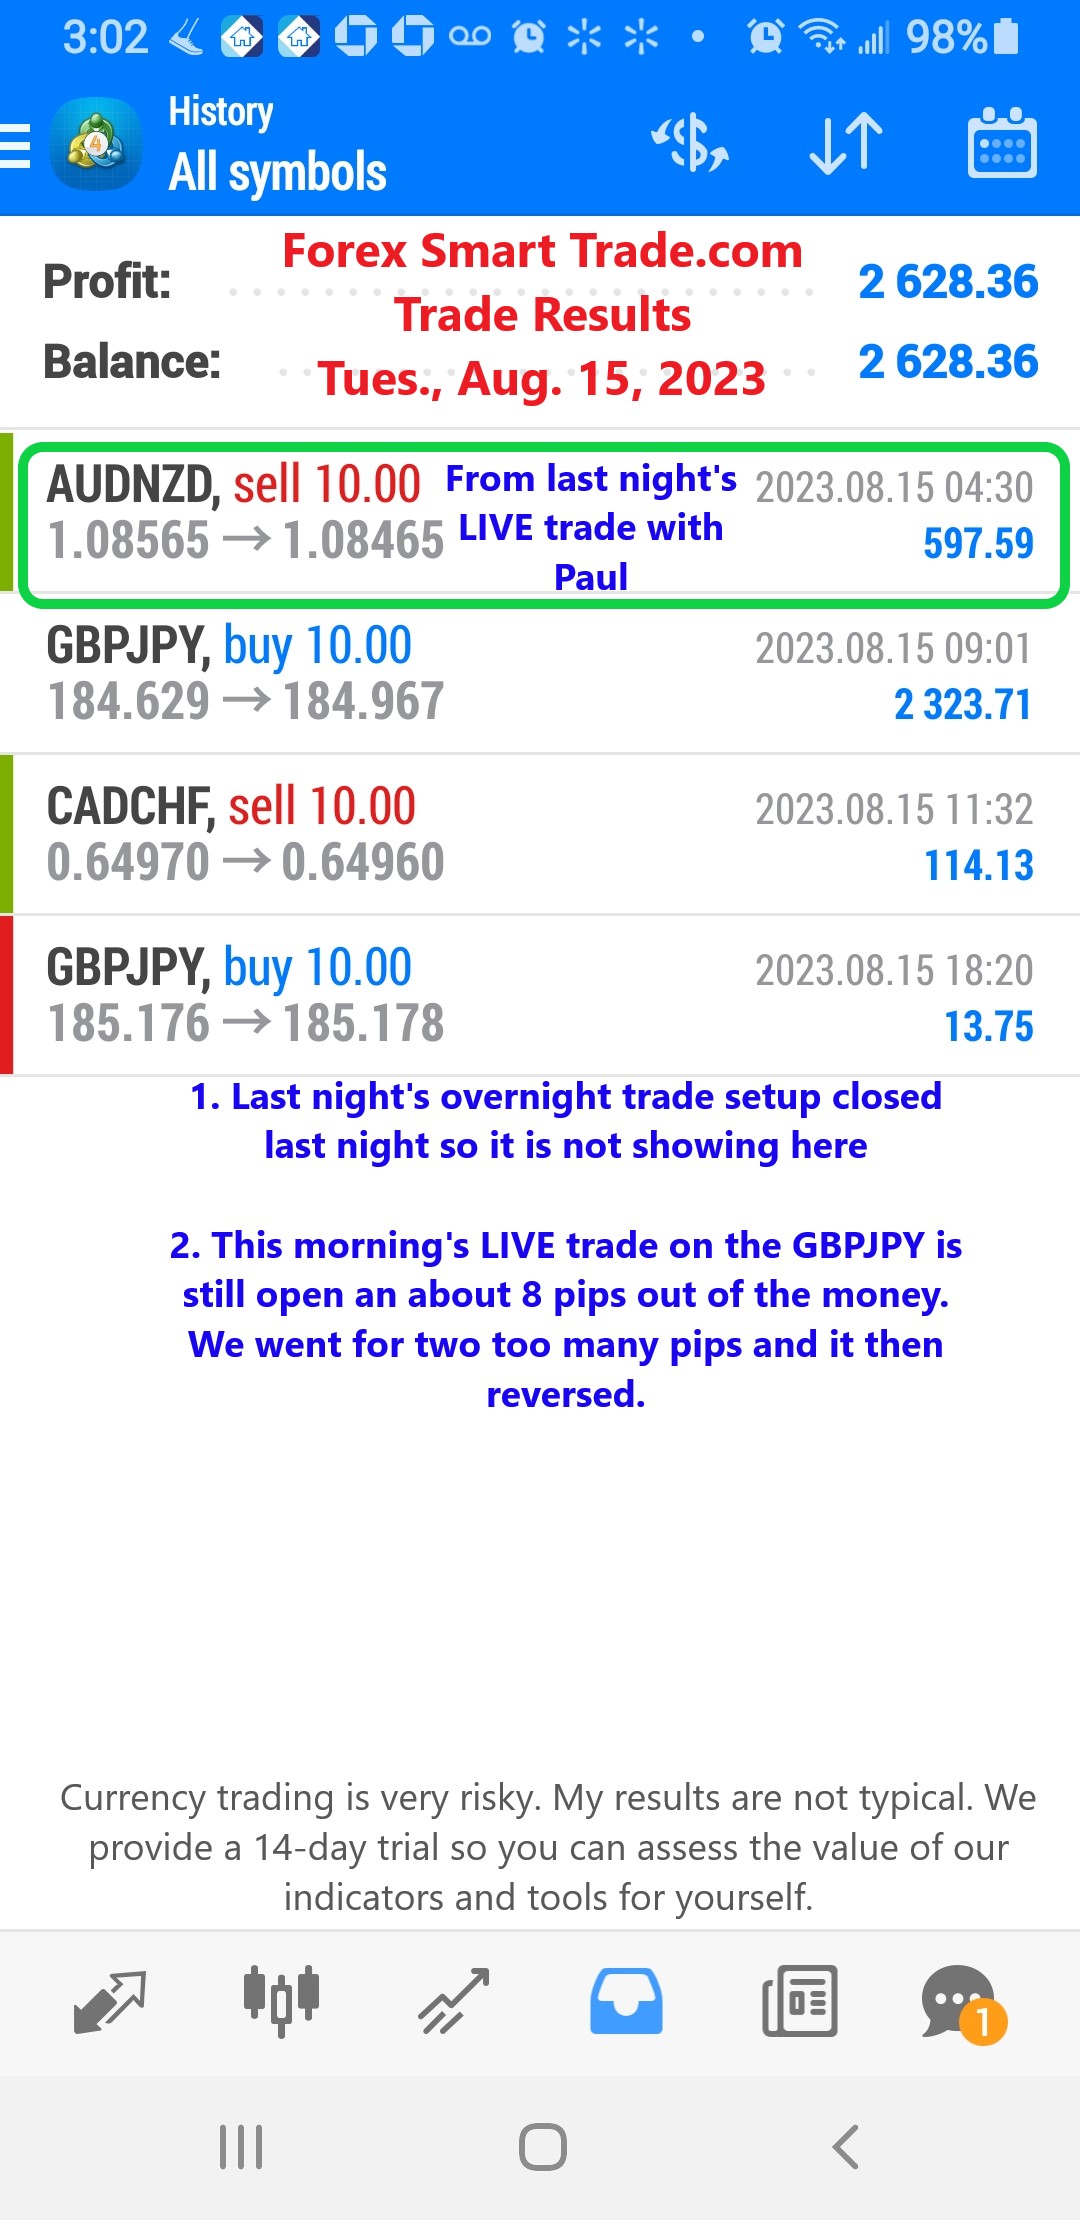
Forex Smart Trade Results, Tuesday, August 15, 2023 – $2,628
Descending Triangle. Now let’s take a look at a descending triangle. As you probably guessed, descending triangles are the exact opposite of ascending triangles. In descending […]
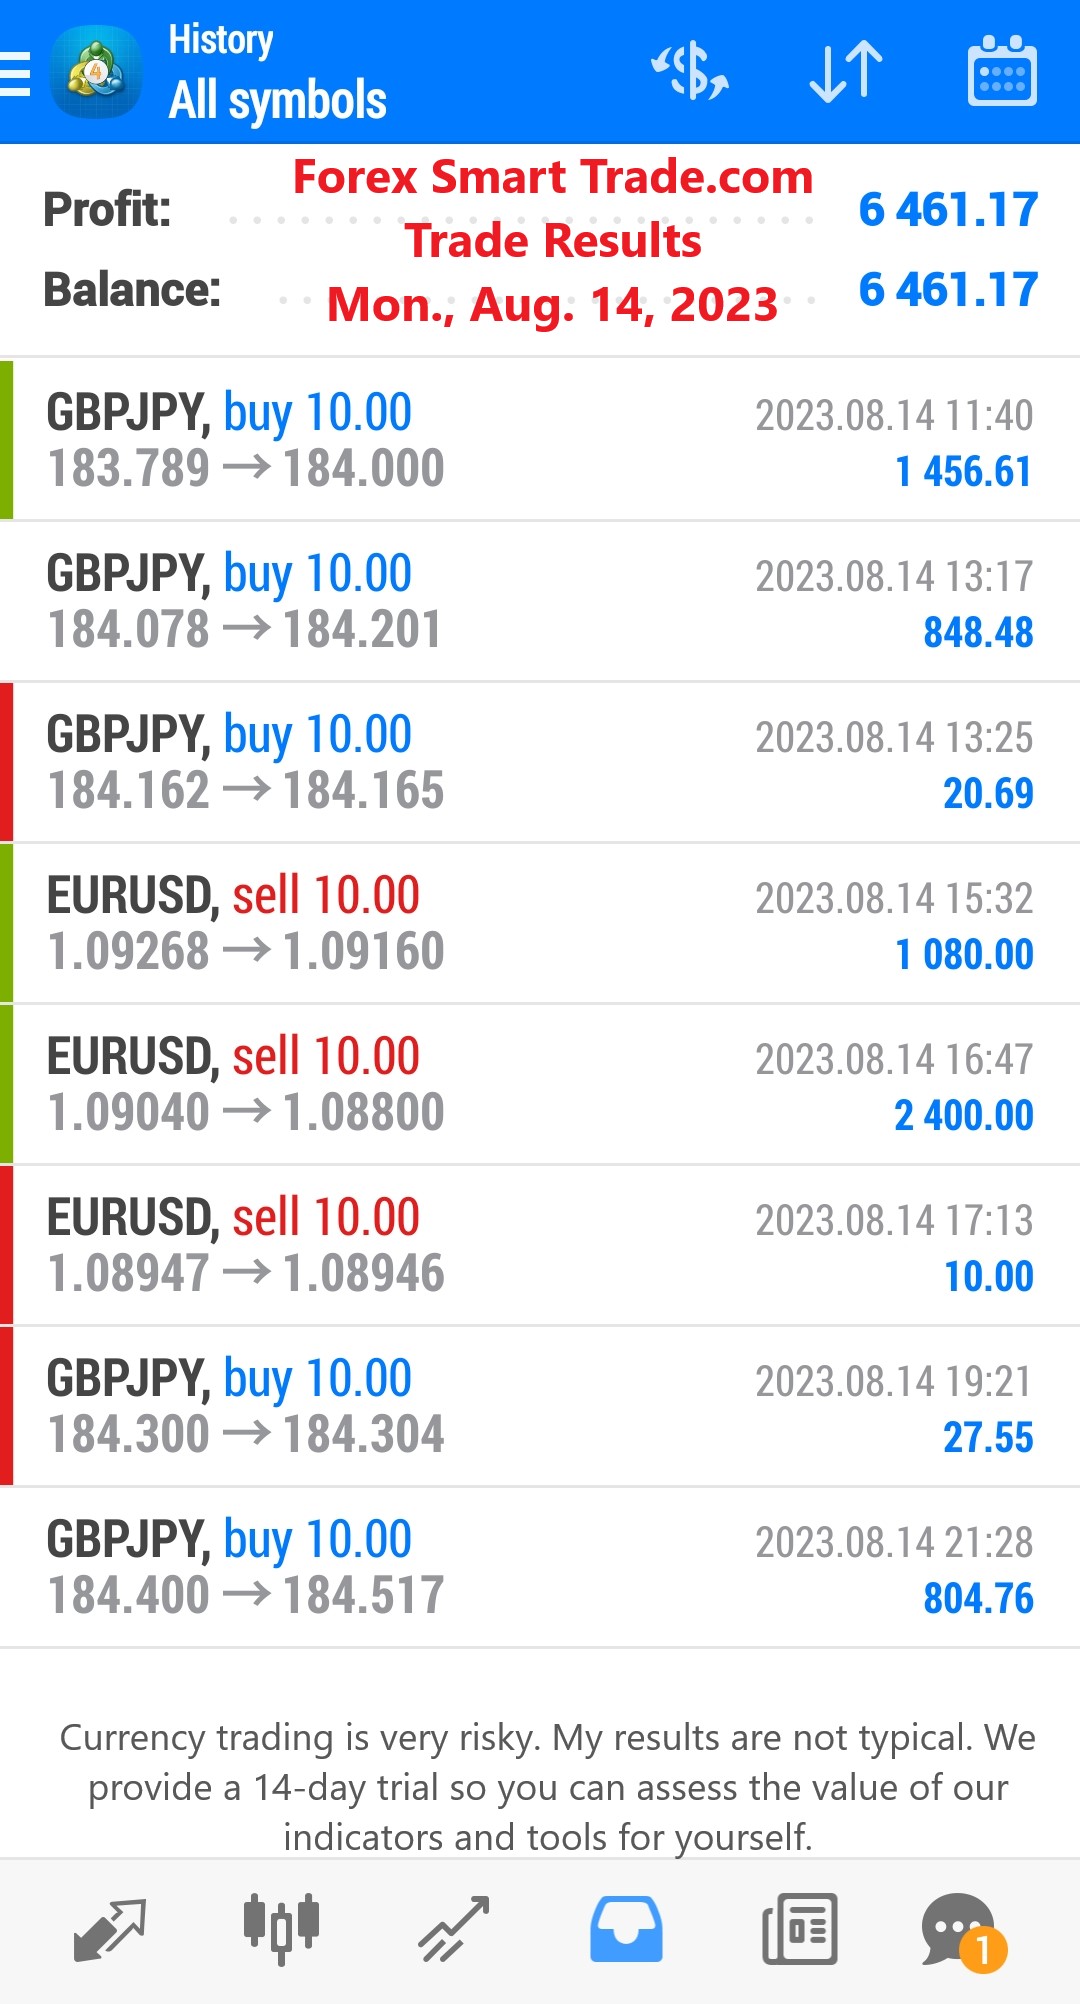
Forex Smart Trade Results, Monday, August 14, 2023, $6,461
Ascending Triangle. An ascending triangle is a type of triangle chart pattern that occurs when there is a resistance level and a slope of higher lows. […]
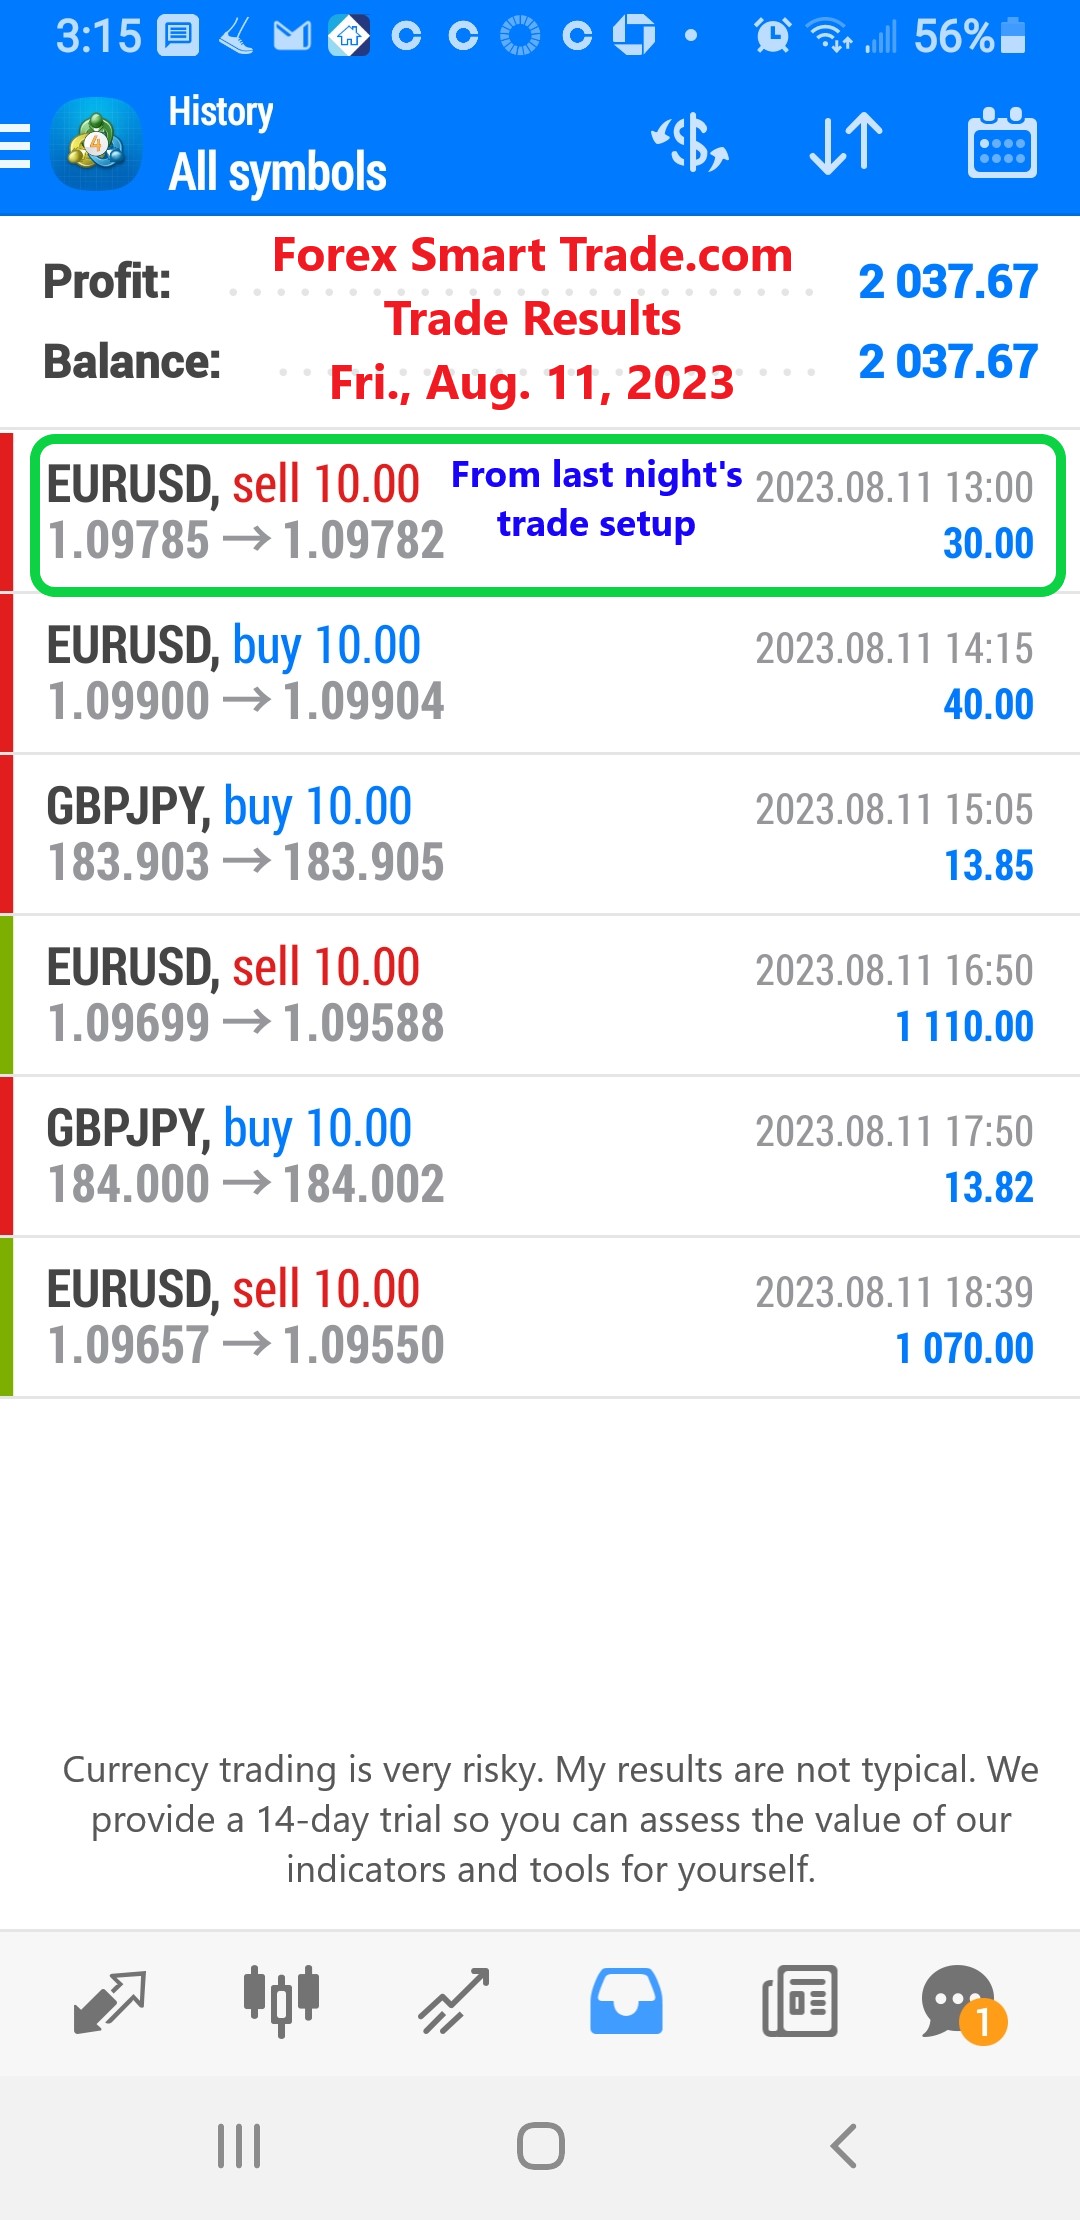
Forex Smart Trade Results, Friday, August 11, 2023 – $2,037
Symmetrical Triangle. A symmetrical triangle is a chart formation where the slope of the price’s highs and the slope of the price’s lows converge together to a point […]
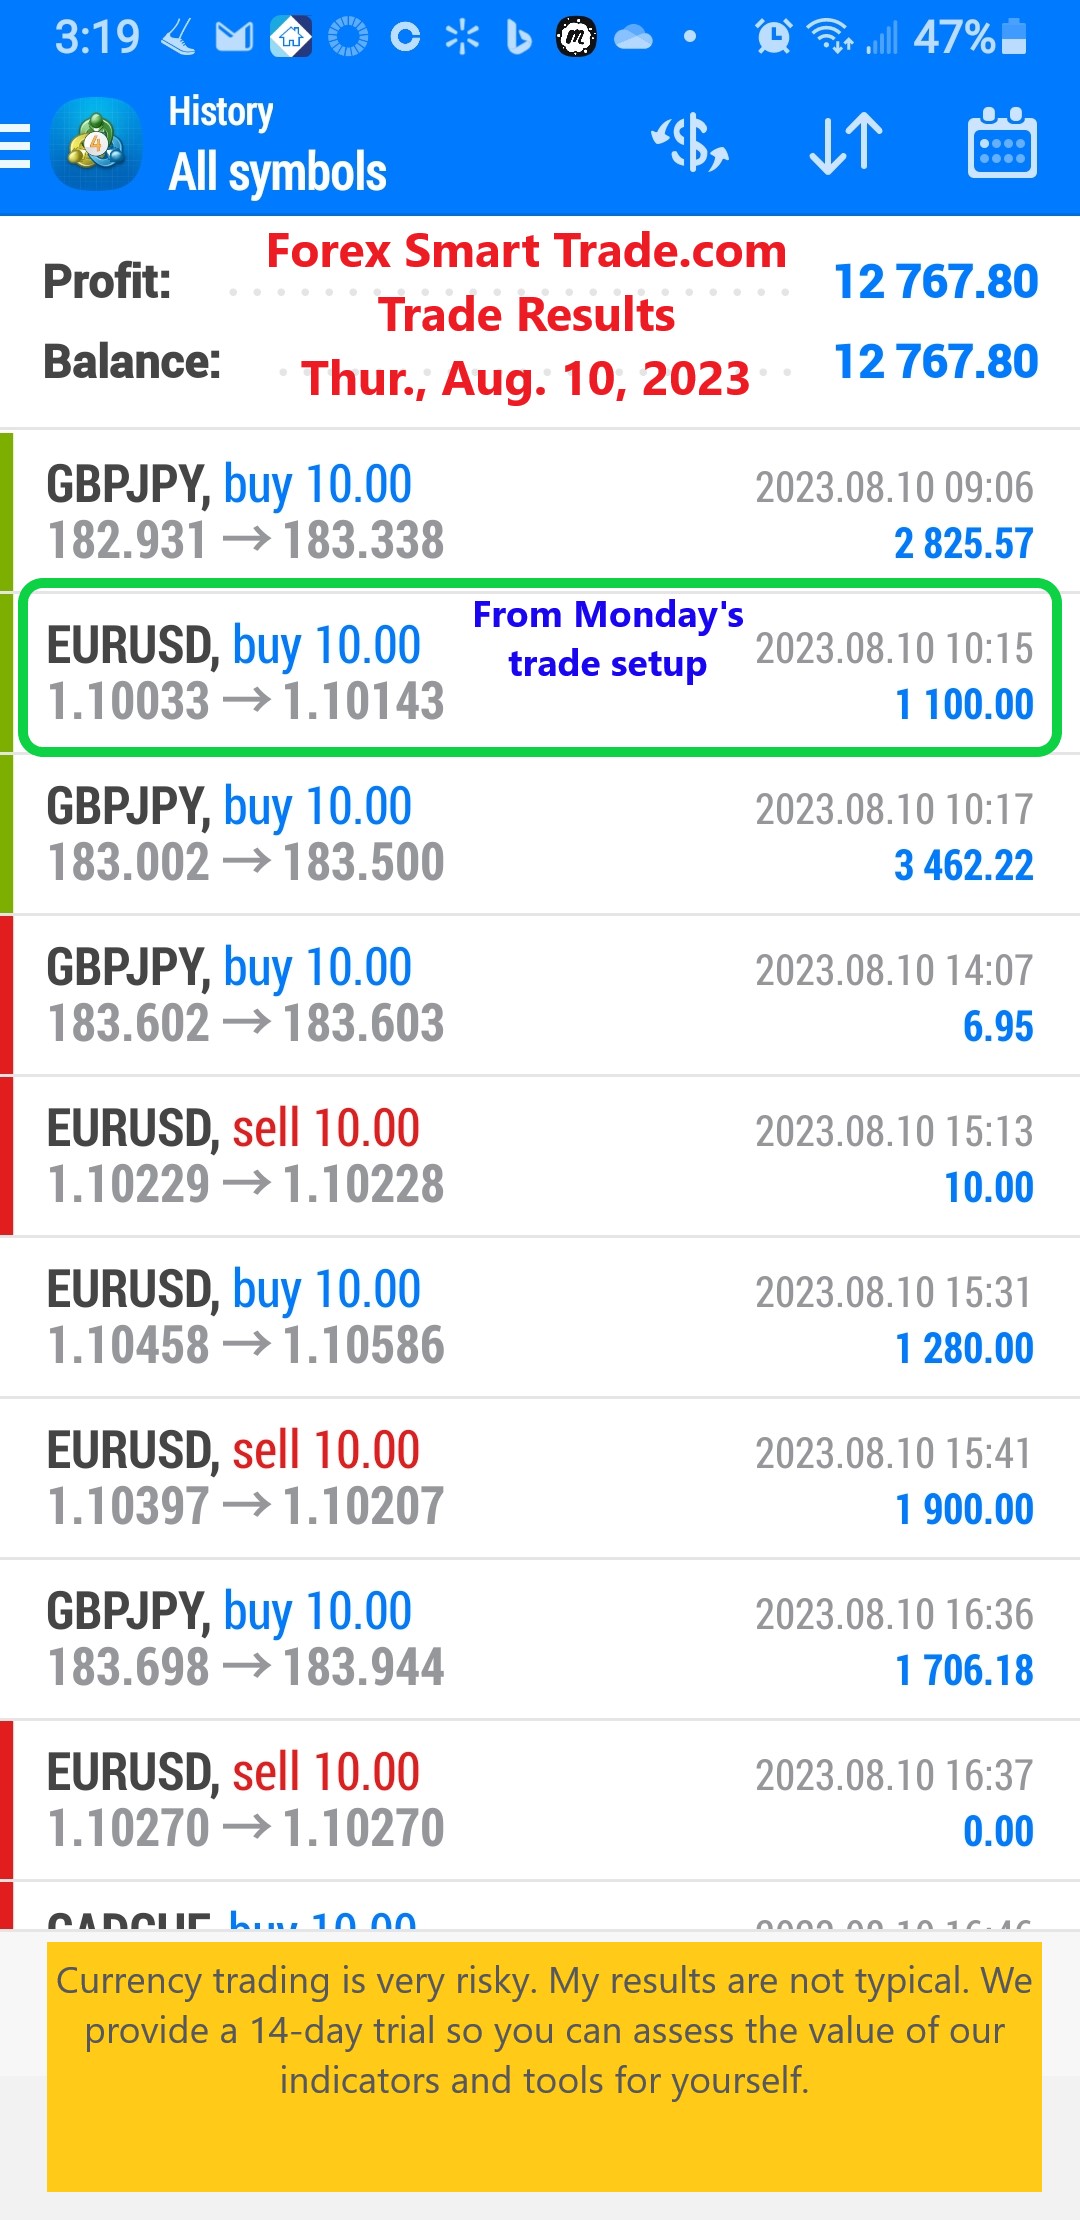
Forex Smart Trade Results, Thursday, August 10, 2023 – $12,767
How to Trade Triangle Chart Patterns. Let’s examine how to trade triangle chart patterns. A triangle chart pattern involves price moving into a tighter and tighter […]
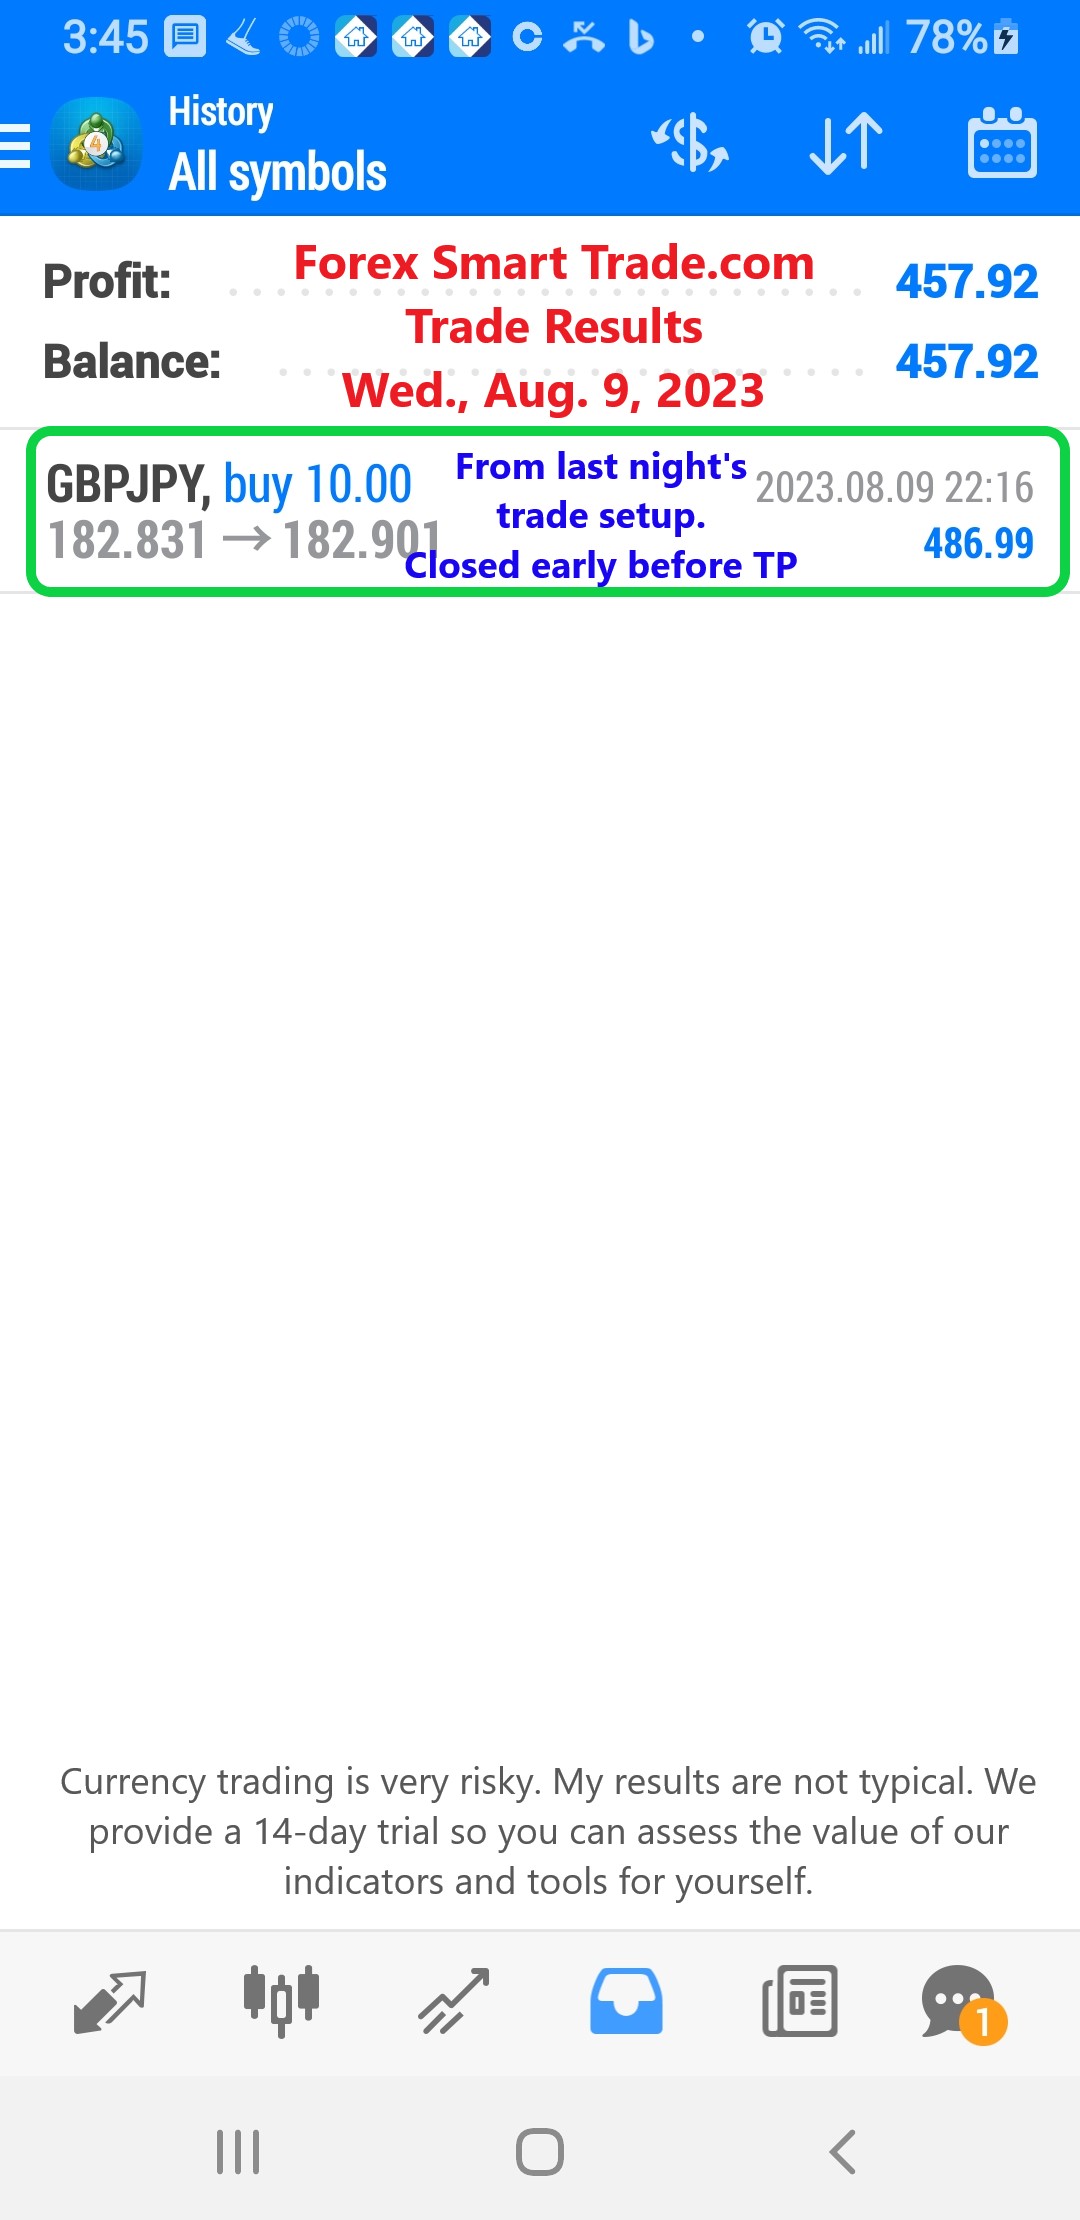
Forex Smart Trade Results, Wednesday, August 9, 2023 – $457
Bullish Pennants. Now let’s take a look at bullish pennants. Bullish pennants, just like its name suggests, signals that bulls are about to go a-chargin’ again. […]
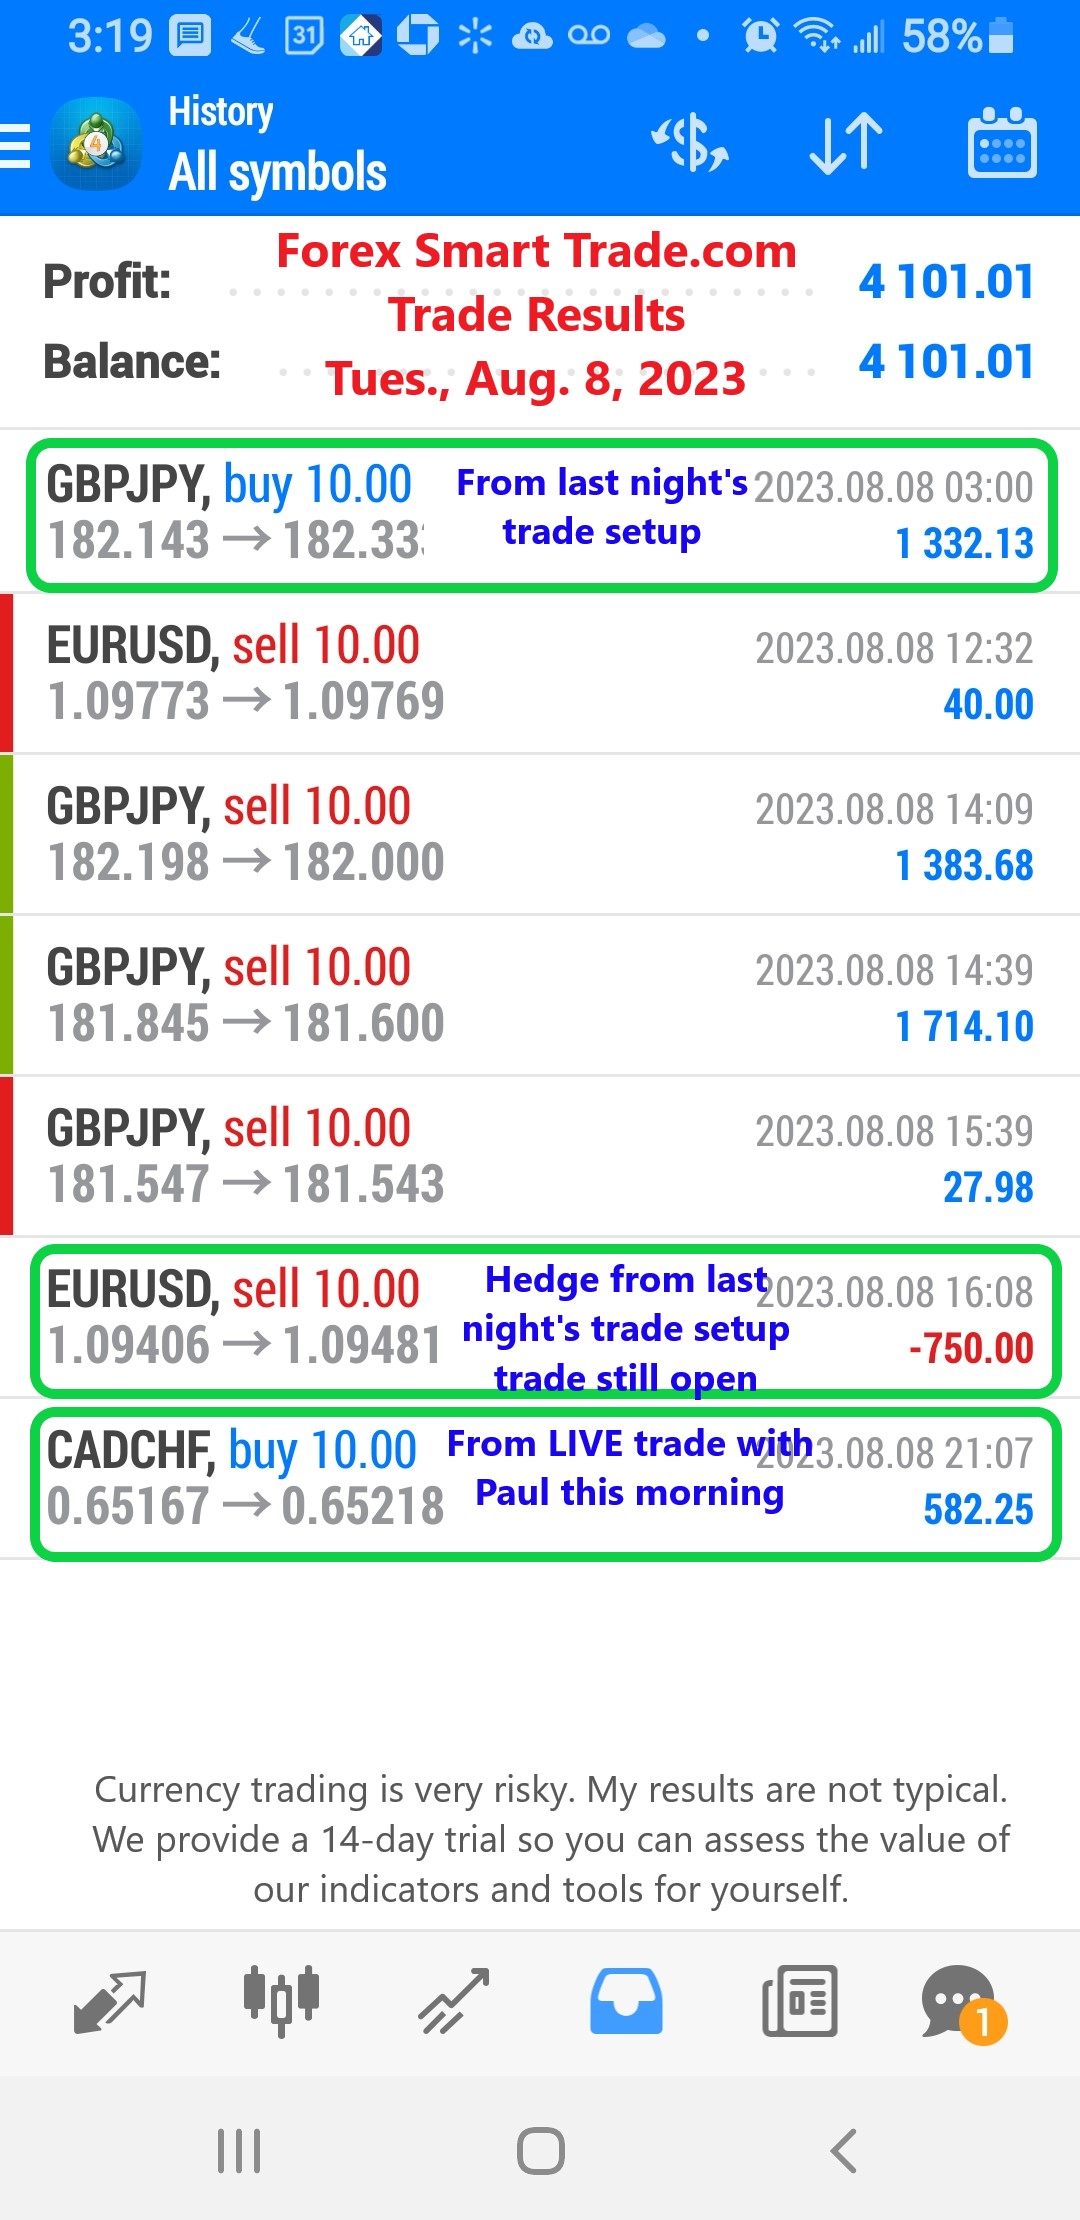
Forex Smart Trade Results, Tuesday, August 8, 2023 – $4,101
How to Trade Bearish and Bullish Pennants. Let’s take a look at how to trade bearish and bullish pennants. Similar to rectangles, pennants are continuation chart […]
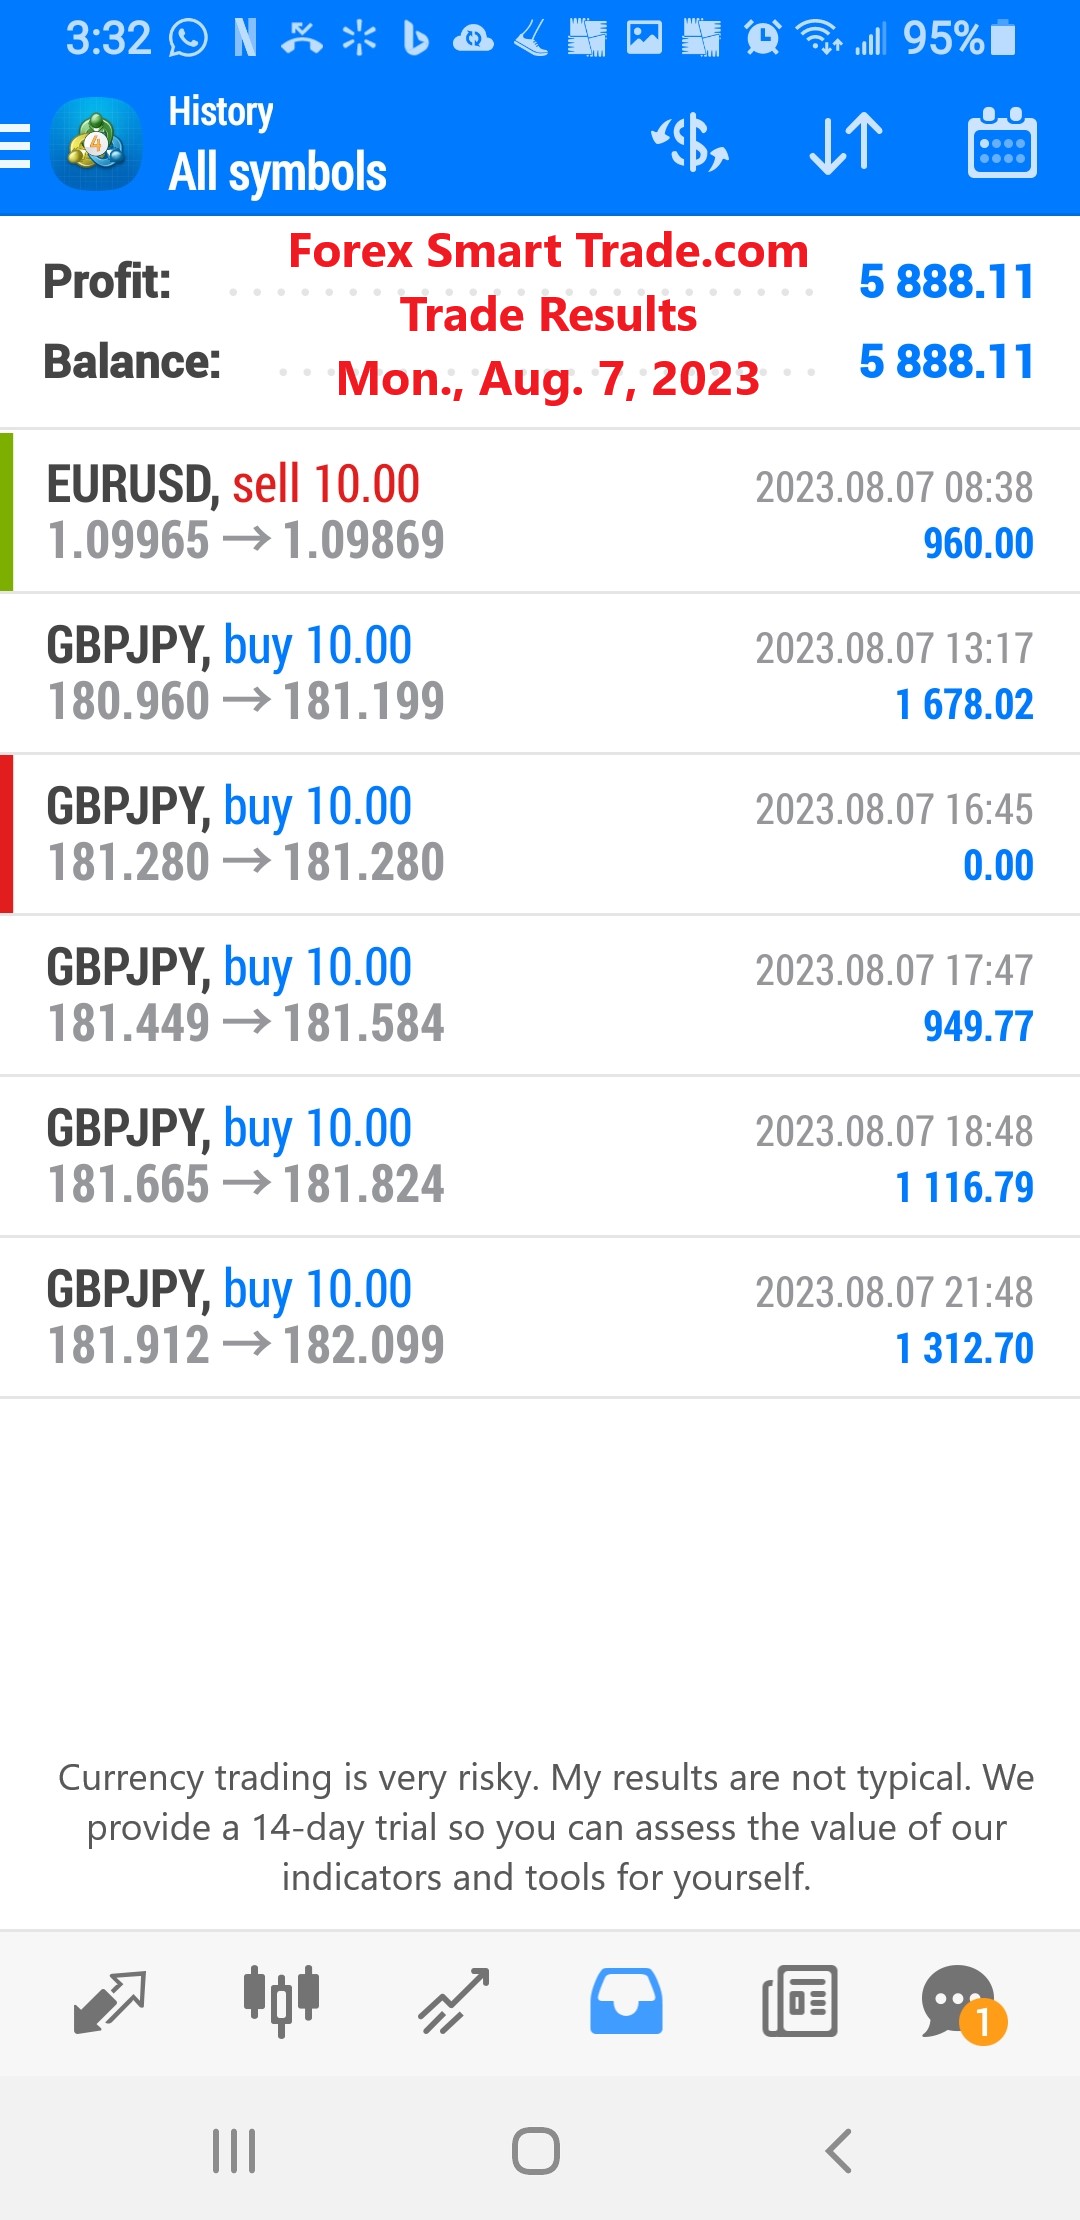
Forex Smart Trade Results, Monday, August 7, 2023 – $5,888
Bearish Rectangle. A bearish rectangle is formed when the price consolidates for a while during a downtrend. This happens because sellers probably need to pause and catch their […]
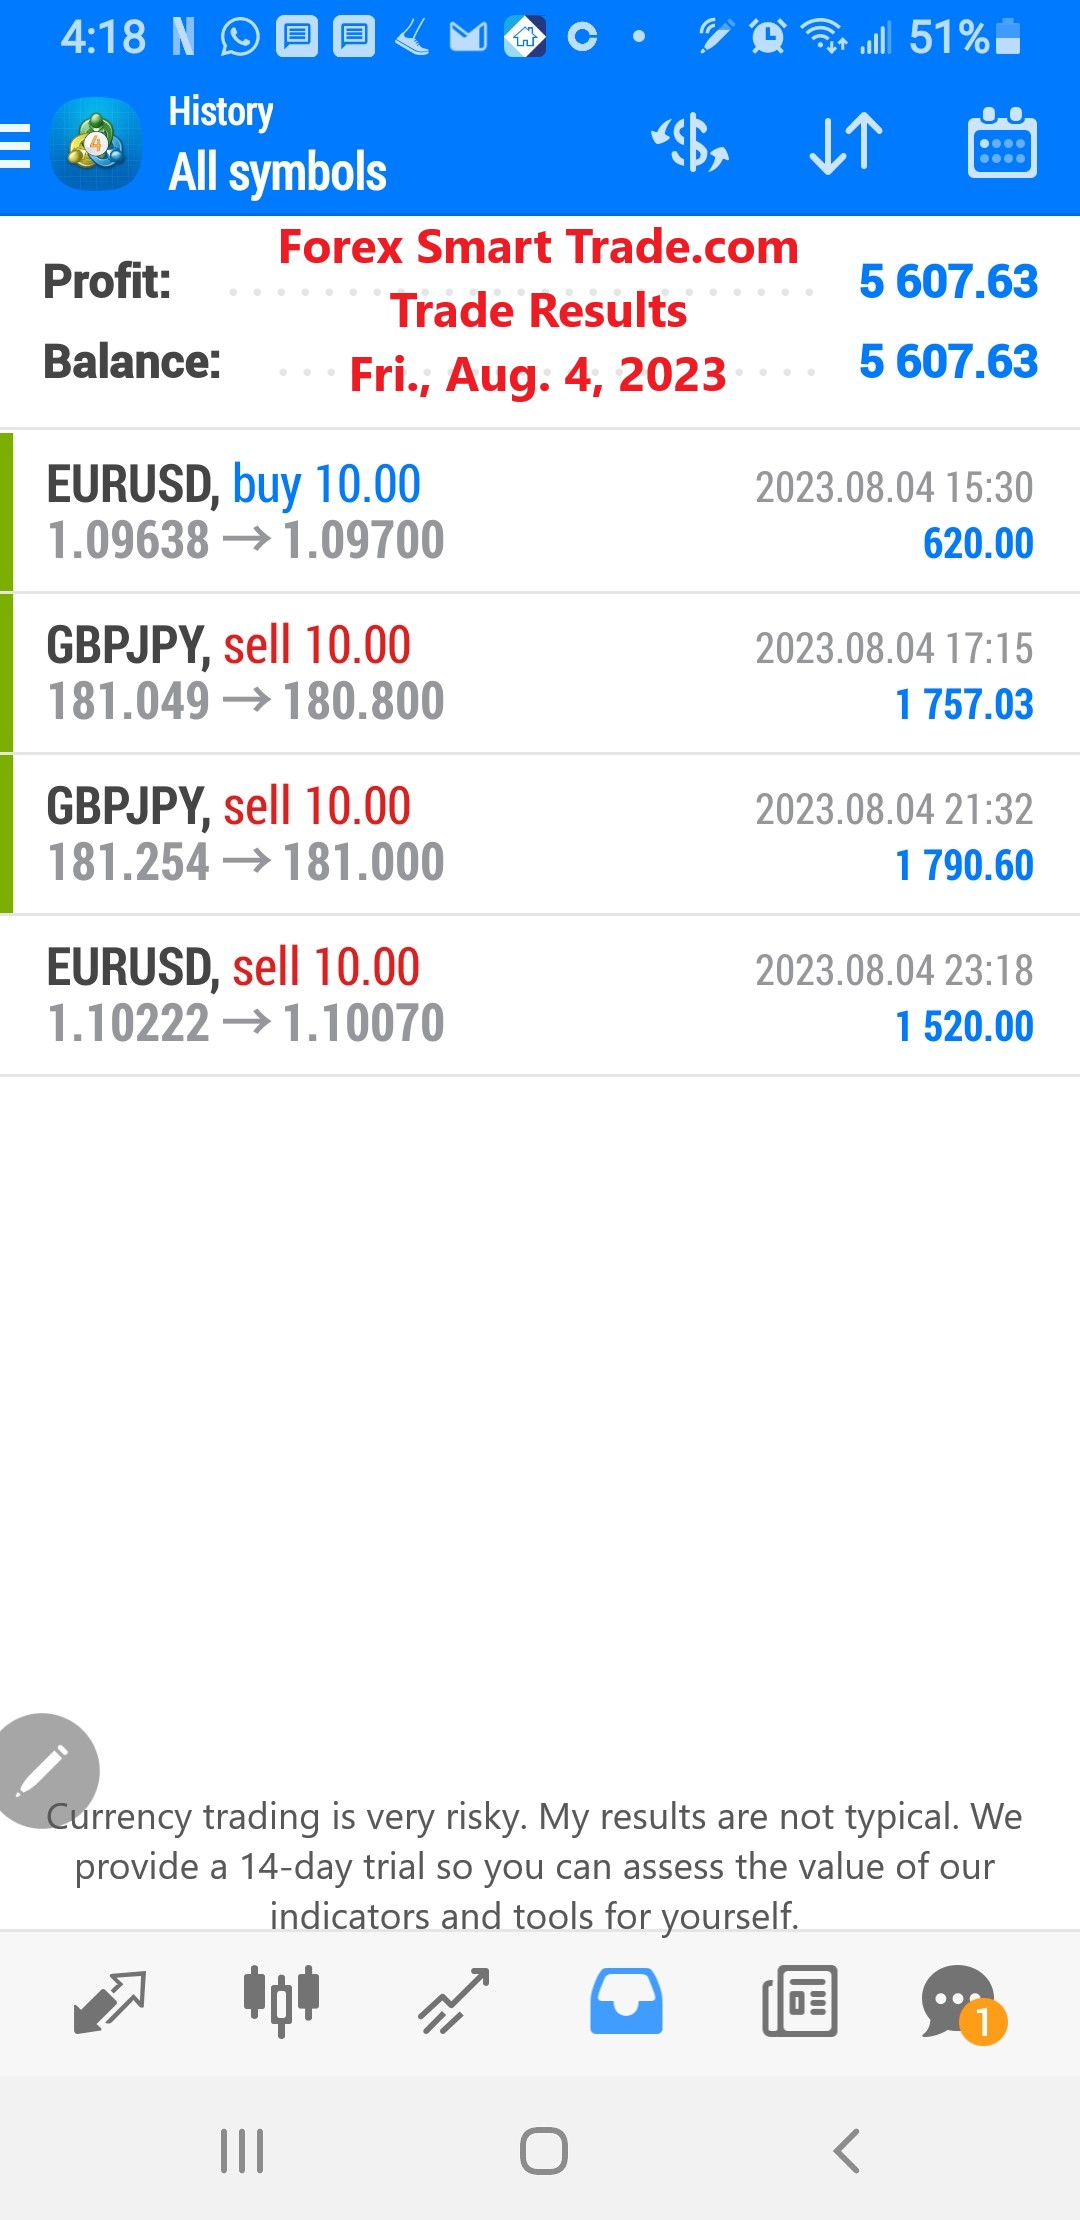
Forex Smart Trade Results, Friday, August 4, 2023 – $5,607
Rectangle Chart Patterns to Trade Breakouts. Let’s look at how to use rectangle chart patterns to trade breakouts. What is a rectangle chart pattern? A rectangle is […]
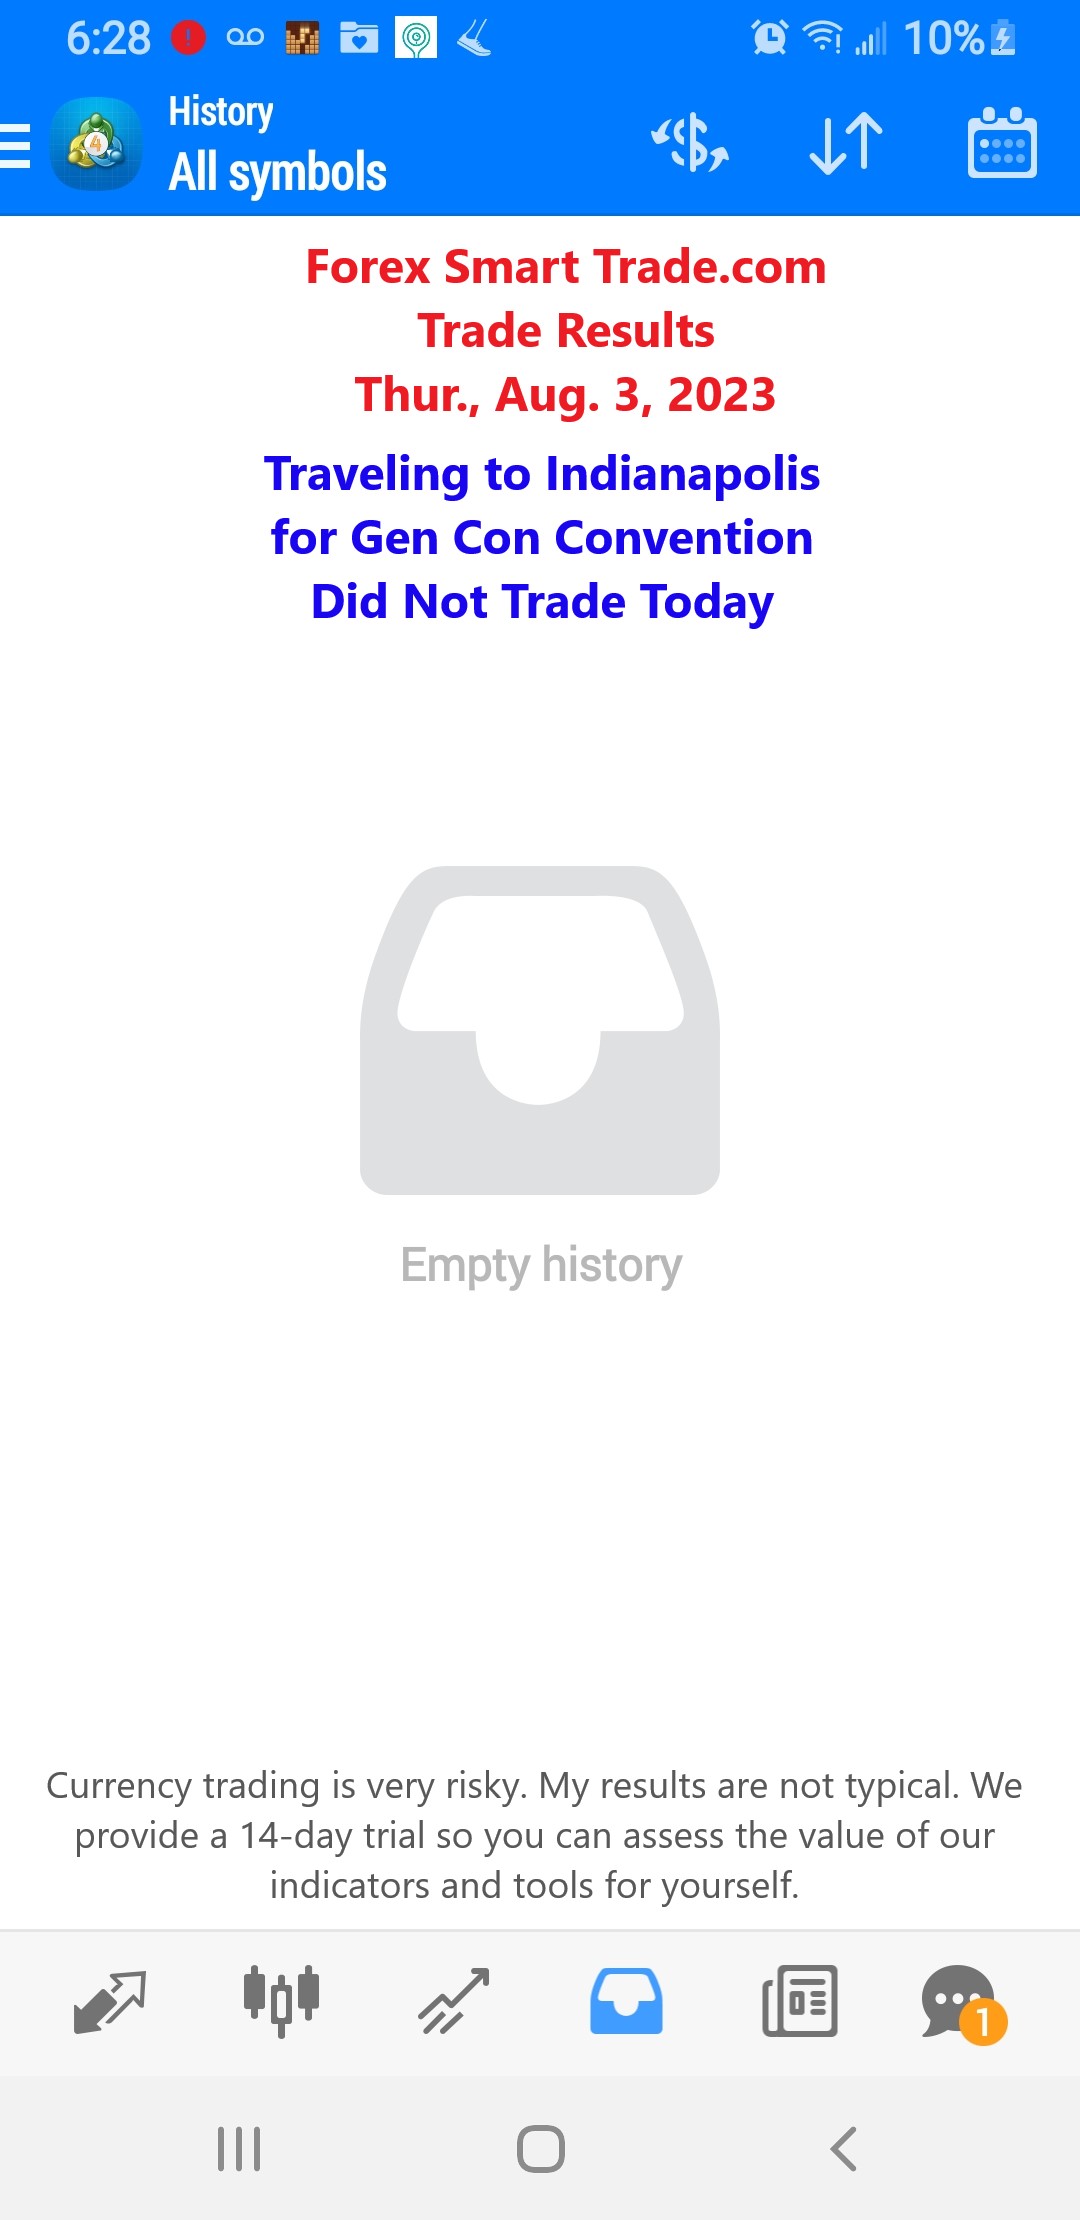
Forex Smart Trade Results, Thursday, August 3, 2023 – Did Not Trade Today – Travel to Indianapolis for Gen Con
Falling Wedge. Just like the rising wedge, the falling wedge can either be a reversal or continuation signal. As a reversal signal, they form it at the bottom […]
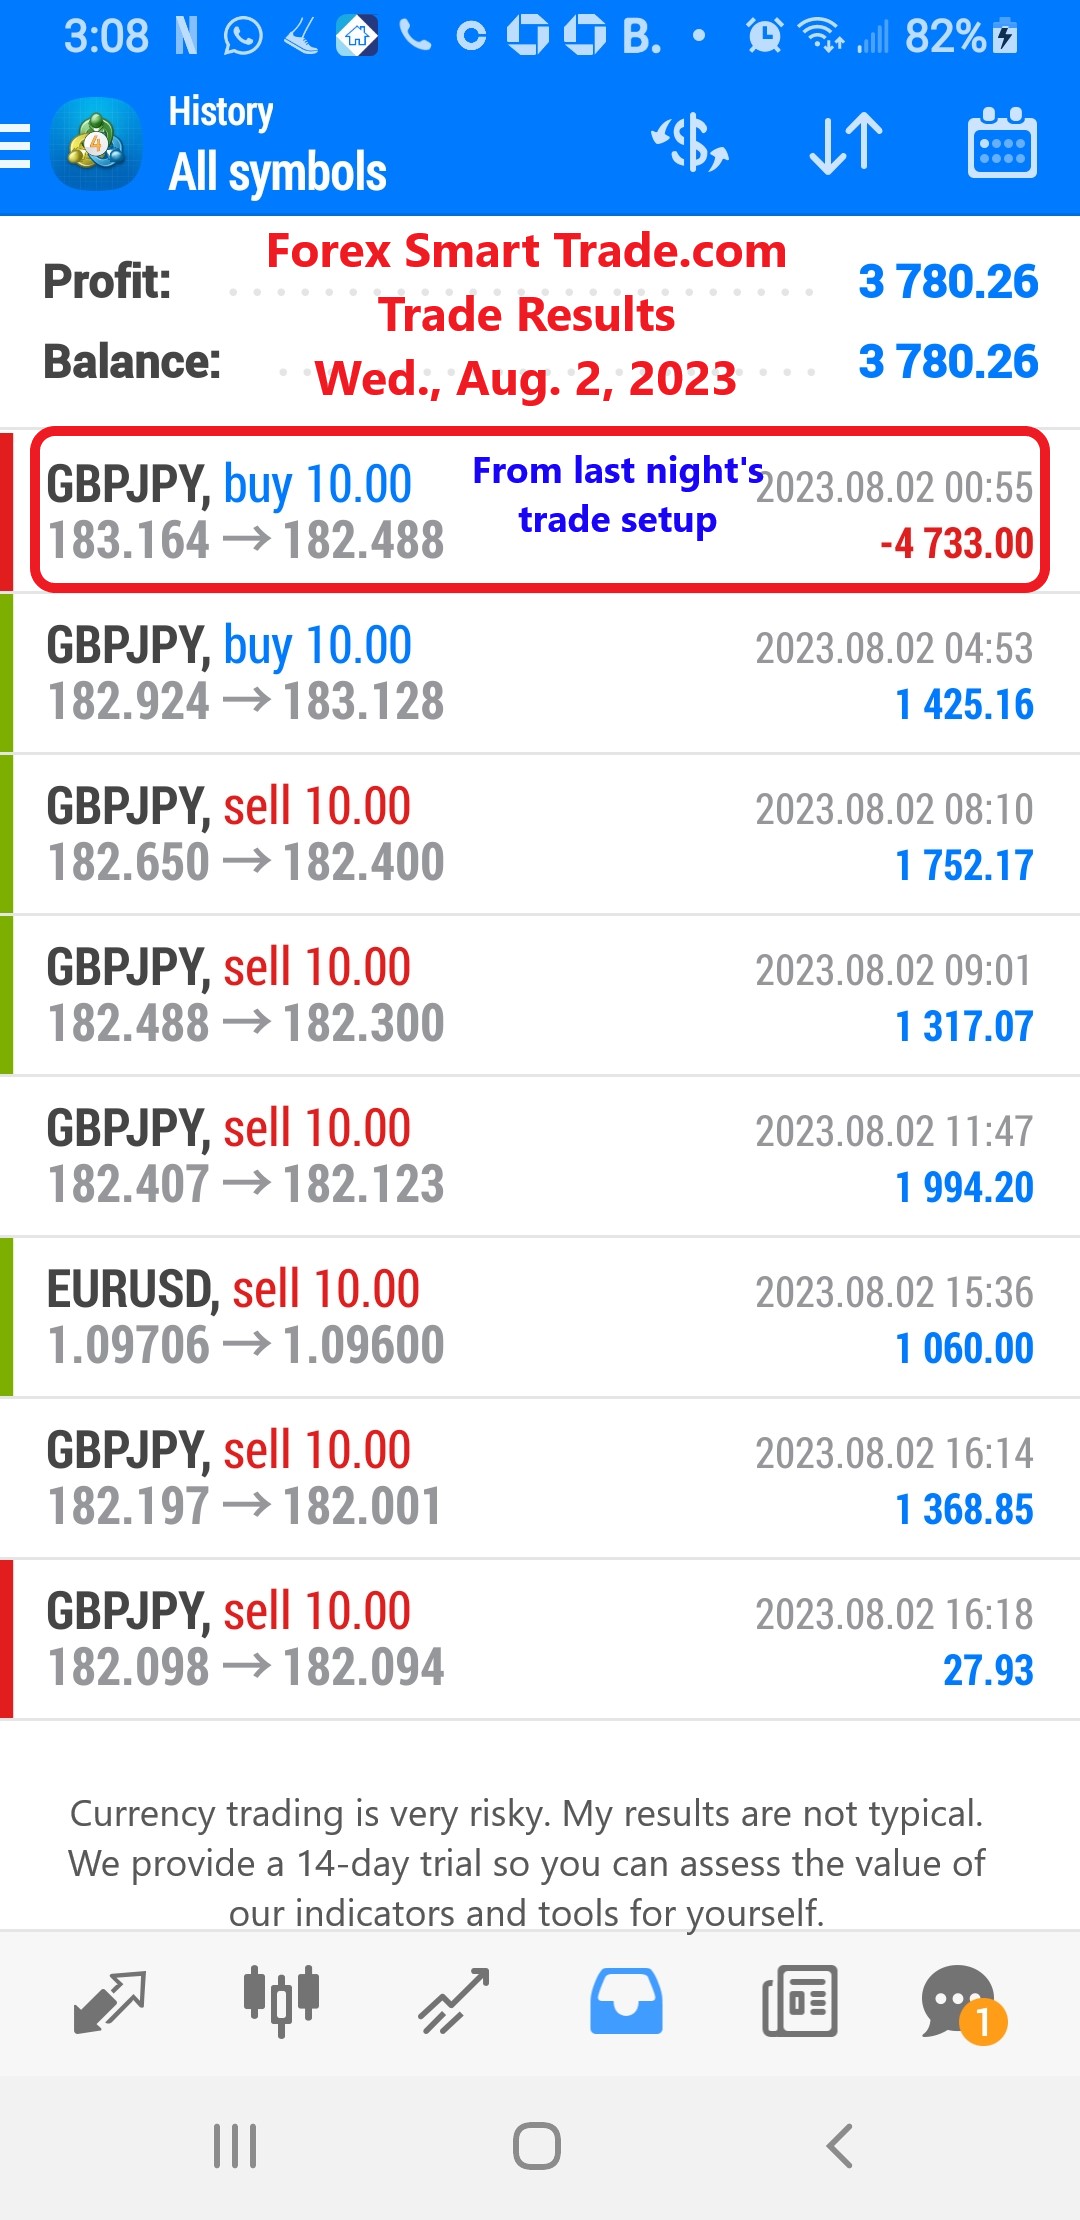
Forex Smart Trade Results, Wednesday, August 2, 2023 – $3,780
Rising Wedge. A rising wedge is formed when the price consolidates between upward-sloping support and resistance lines. Here, the slope of the support line is steeper than […]