Forex Smart Trade Results, Wednesday, August 2, 2023 – $3,780

Forex Smart Trade Results, Tuesday, August 1, 2023 – $4,361
August 26, 2023
Forex Smart Trade Results, Thursday, August 3, 2023 – Did Not Trade Today – Travel to Indianapolis for Gen Con
August 26, 2023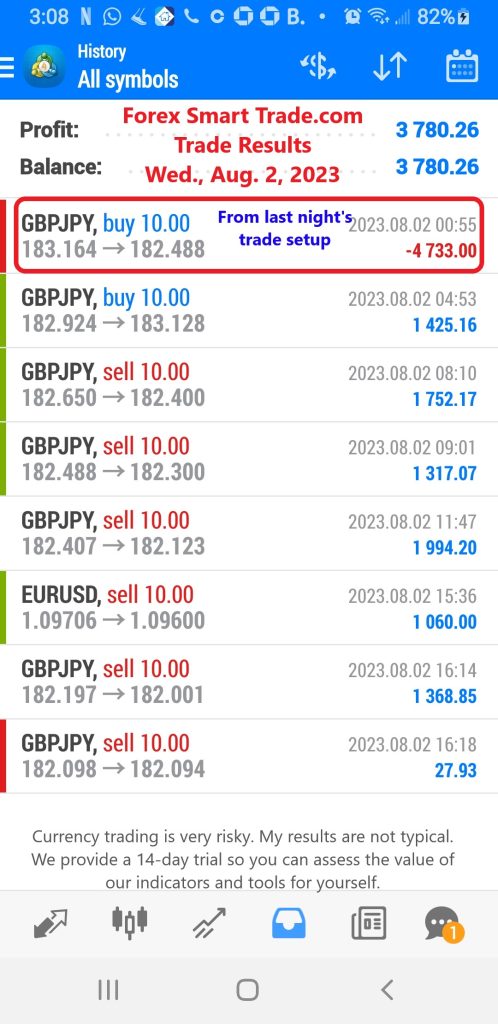
Rising Wedge.
A rising wedge is formed when the price consolidates between upward-sloping support and resistance lines.
Here, the slope of the support line is steeper than that of the resistance.
This indicates that higher lows are being formed faster than higher highs. This leads to a wedge-like formation, which is exactly where the chart pattern gets its name from!
With prices consolidating, we know that a big splash is coming, so we can expect a breakout to either the top or bottom.
If the rising wedge forms after an uptrend, it’s usually a bearish reversal pattern.
On the other hand, if it forms during a downtrend, it could signal a continuation of the downmove.
Either way, the important thing is that, when you spot this forex trading chart pattern, you’re ready with your entry orders!

In this first example, a rising wedge formed at the end of an uptrend.
Notice how price action is forming new highs but at a much slower pace than when price makes higher lows.

See how the price broke down to the downside? That means there are more forex traders desperate to be short than long!
They pushed the price down to break the trend line, indicating that a downtrend may be in the cards.
Just like in the other forex trading chart patterns we discussed earlier, the price movement after the breakout is approximately the same magnitude as the height of the formation.
Now let’s take a look at another example of a rising wedge formation.
Only this time it acts as a bearish continuation signal.

As you can see, the price came from a downtrend before consolidating and sketching higher highs and even higher lows.

In this case, the price broke to the downside and the downtrend continued.
That’s why it’s called a continuation signal yo!
See how the price made a nice move down that’s the same height as the wedge?
What did we learn so far about these Japanese candlestick chart patterns?
A rising wedge formed after an uptrend usually leads to a REVERSAL (downtrend) while a rising wedge formed during a downtrend typically results in a CONTINUATION (downtrend).
Simply put, a rising wedge leads to a downtrend, which means that it’s a bearish chart pattern!

Learn to Trade Currency
If you’d like to earn extra income trading on the Forex market, consider learning how to currency trade with Forex Smart Trade. With their super-accurate proprietary trading tools and best-in-the-business, personalized one-on-one training, you’ll be successful. Check out the Forex Smart Trade webinar. It shows one of their trader’s trading and how easy, intuitive, and accurate the tools are. Or try the Forex Smart Trade 14-day introductory trial for just TEN dollars.