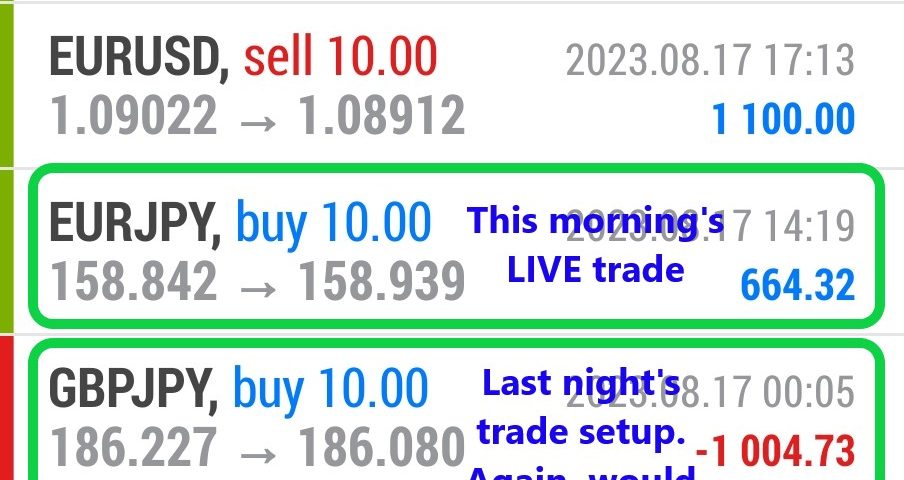
Forex Smart Trade Results, Thursday, August 17, 2023 – $1,085

Forex Smart Trade Results, Wednesday, August 16, 2023 – $6,240
September 2, 2023
Forex Smart Trade Results, Friday, August 18, 2023 – $1,393
September 2, 2023Continuation Chart Patterns.
Let’s look at continuation chart patterns.
These chart patterns are those chart formations that signal that the ongoing trend will resume.
Usually, these are also known as consolidation patterns.
This is because they show how buyers or sellers take a quick break before moving further in the same direction as the prior trend.
Trends don’t usually move in a straight line higher or lower.
They pause and move sideways, “correct” lower or higher.
And then regain momentum to continue the overall trend.
We’ve covered several continuation chart patterns, namely the wedges, rectangles, and pennants.
Note that wedges can be considered either reversal or continuation patterns depending on the trend on which they form.
Examples


Trading the Patterns
To trade these patterns, simply place an order above or below the formation (following the direction of the ongoing trend, of course).
Then go for a target that’s at least the size of the chart pattern for wedges and rectangles.
For pennants, you can aim higher and target the height of the pennant’s mast.
With continuation patterns, we usually place stops above or below the actual chart formation.
For example, when trading a bearish rectangle, place your stop a few pips above the top or resistance of the rectangle.

Learn Forex
If you’d like to earn extra income trading on the Forex market, consider learning how to currency trade with Forex Smart Trade. With their super-accurate proprietary trading tools and best-in-the-business, personalized one-on-one training, you’ll be successful. Check out the Forex Smart Trade webinar. It shows one of their trader’s trading and how easy, intuitive, and accurate the tools are. Or try the Forex Smart Trade 14-day introductory trial for just TEN dollars.


