Trade Results
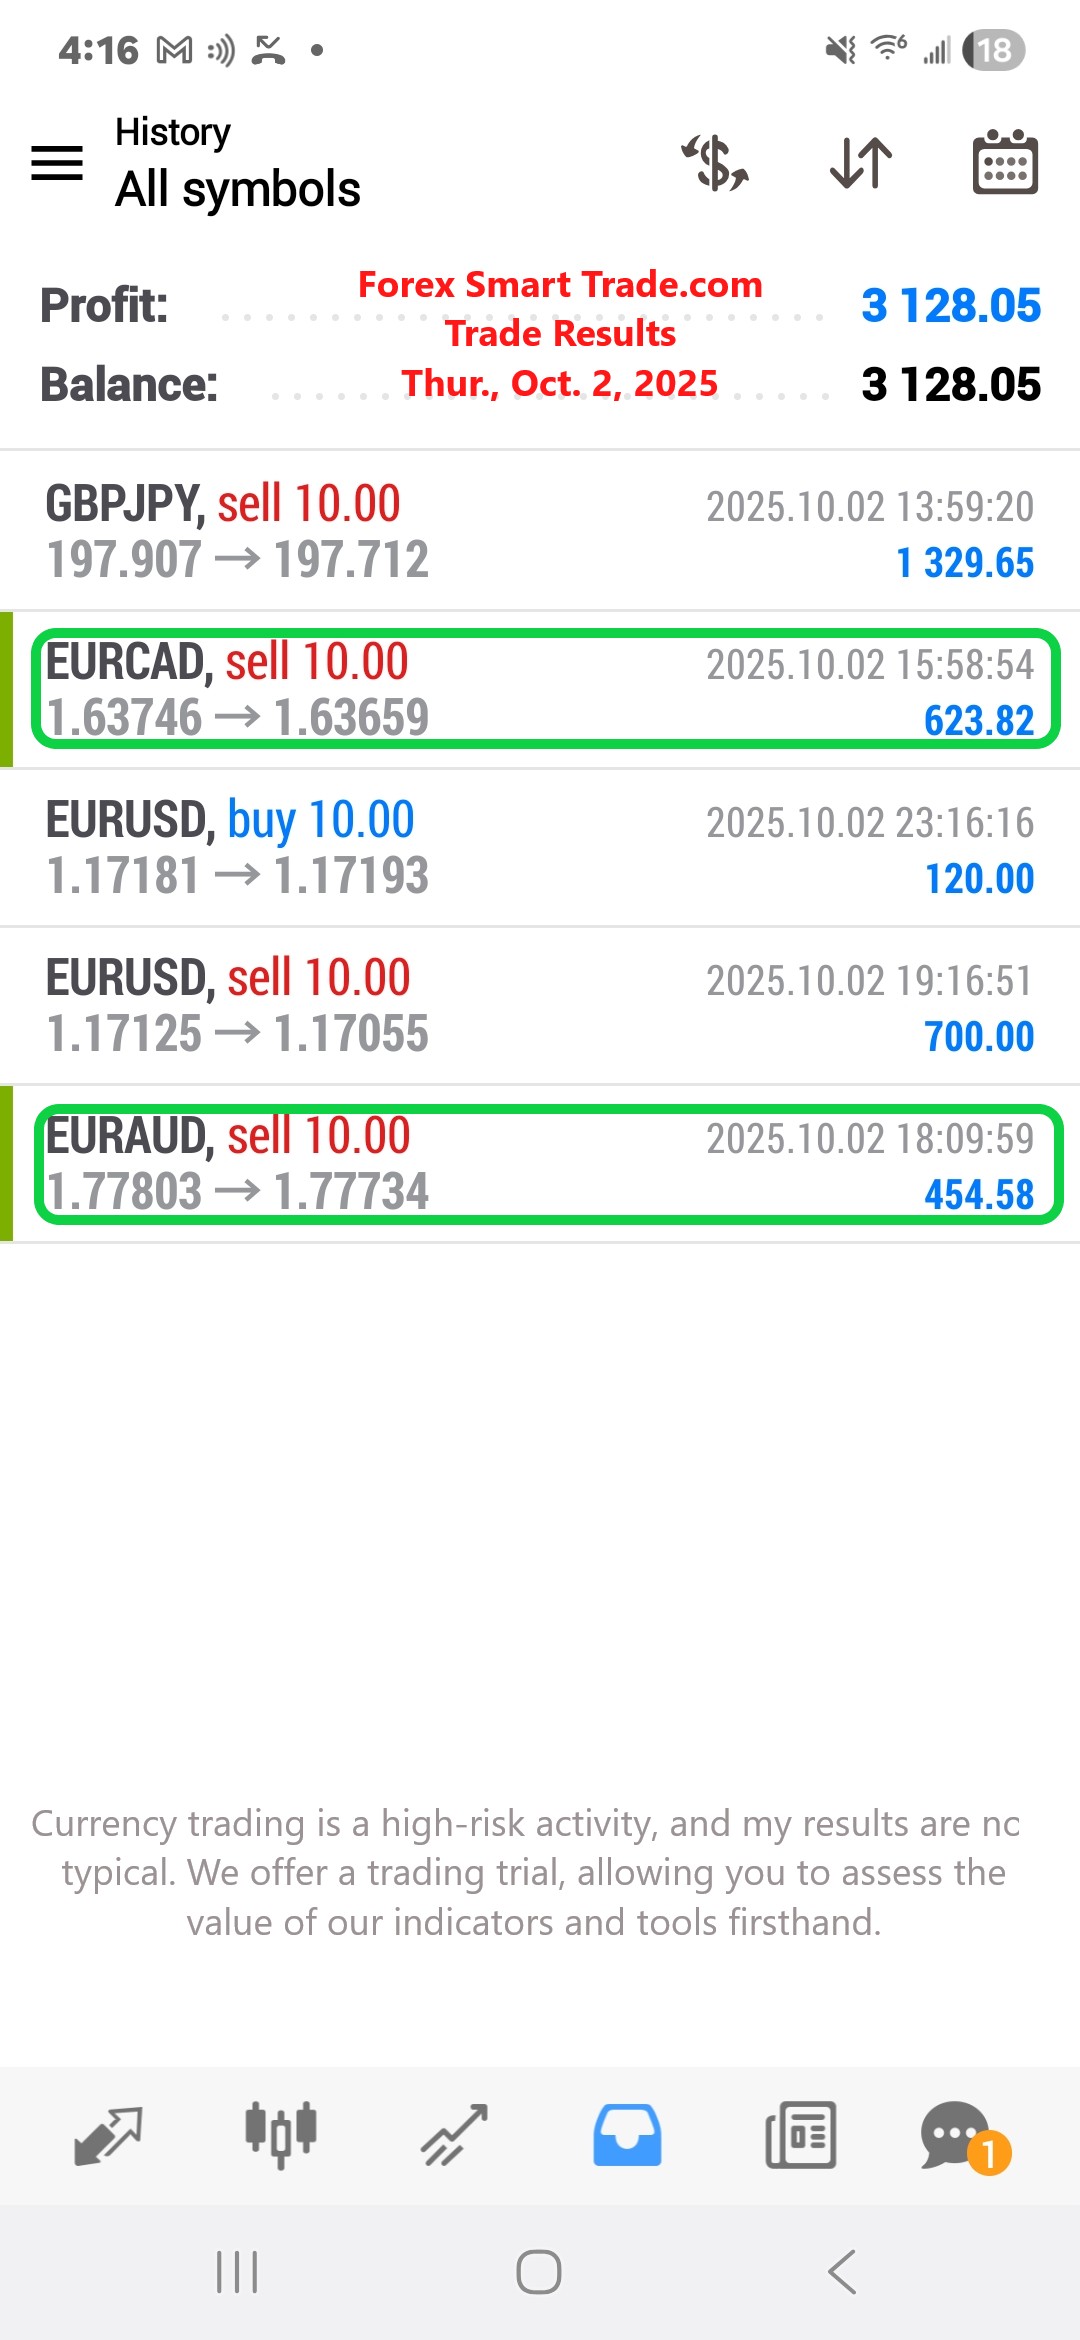
Trade Results. Thur., Oct. 2, 2025: $3,128
The Leadership Law That Transforms Amateur Traders into Market Leaders (John Maxwell’s Secret Applied to Trading). Today’s wisdom is from The 21 Irrefutable Laws of Leadership […]
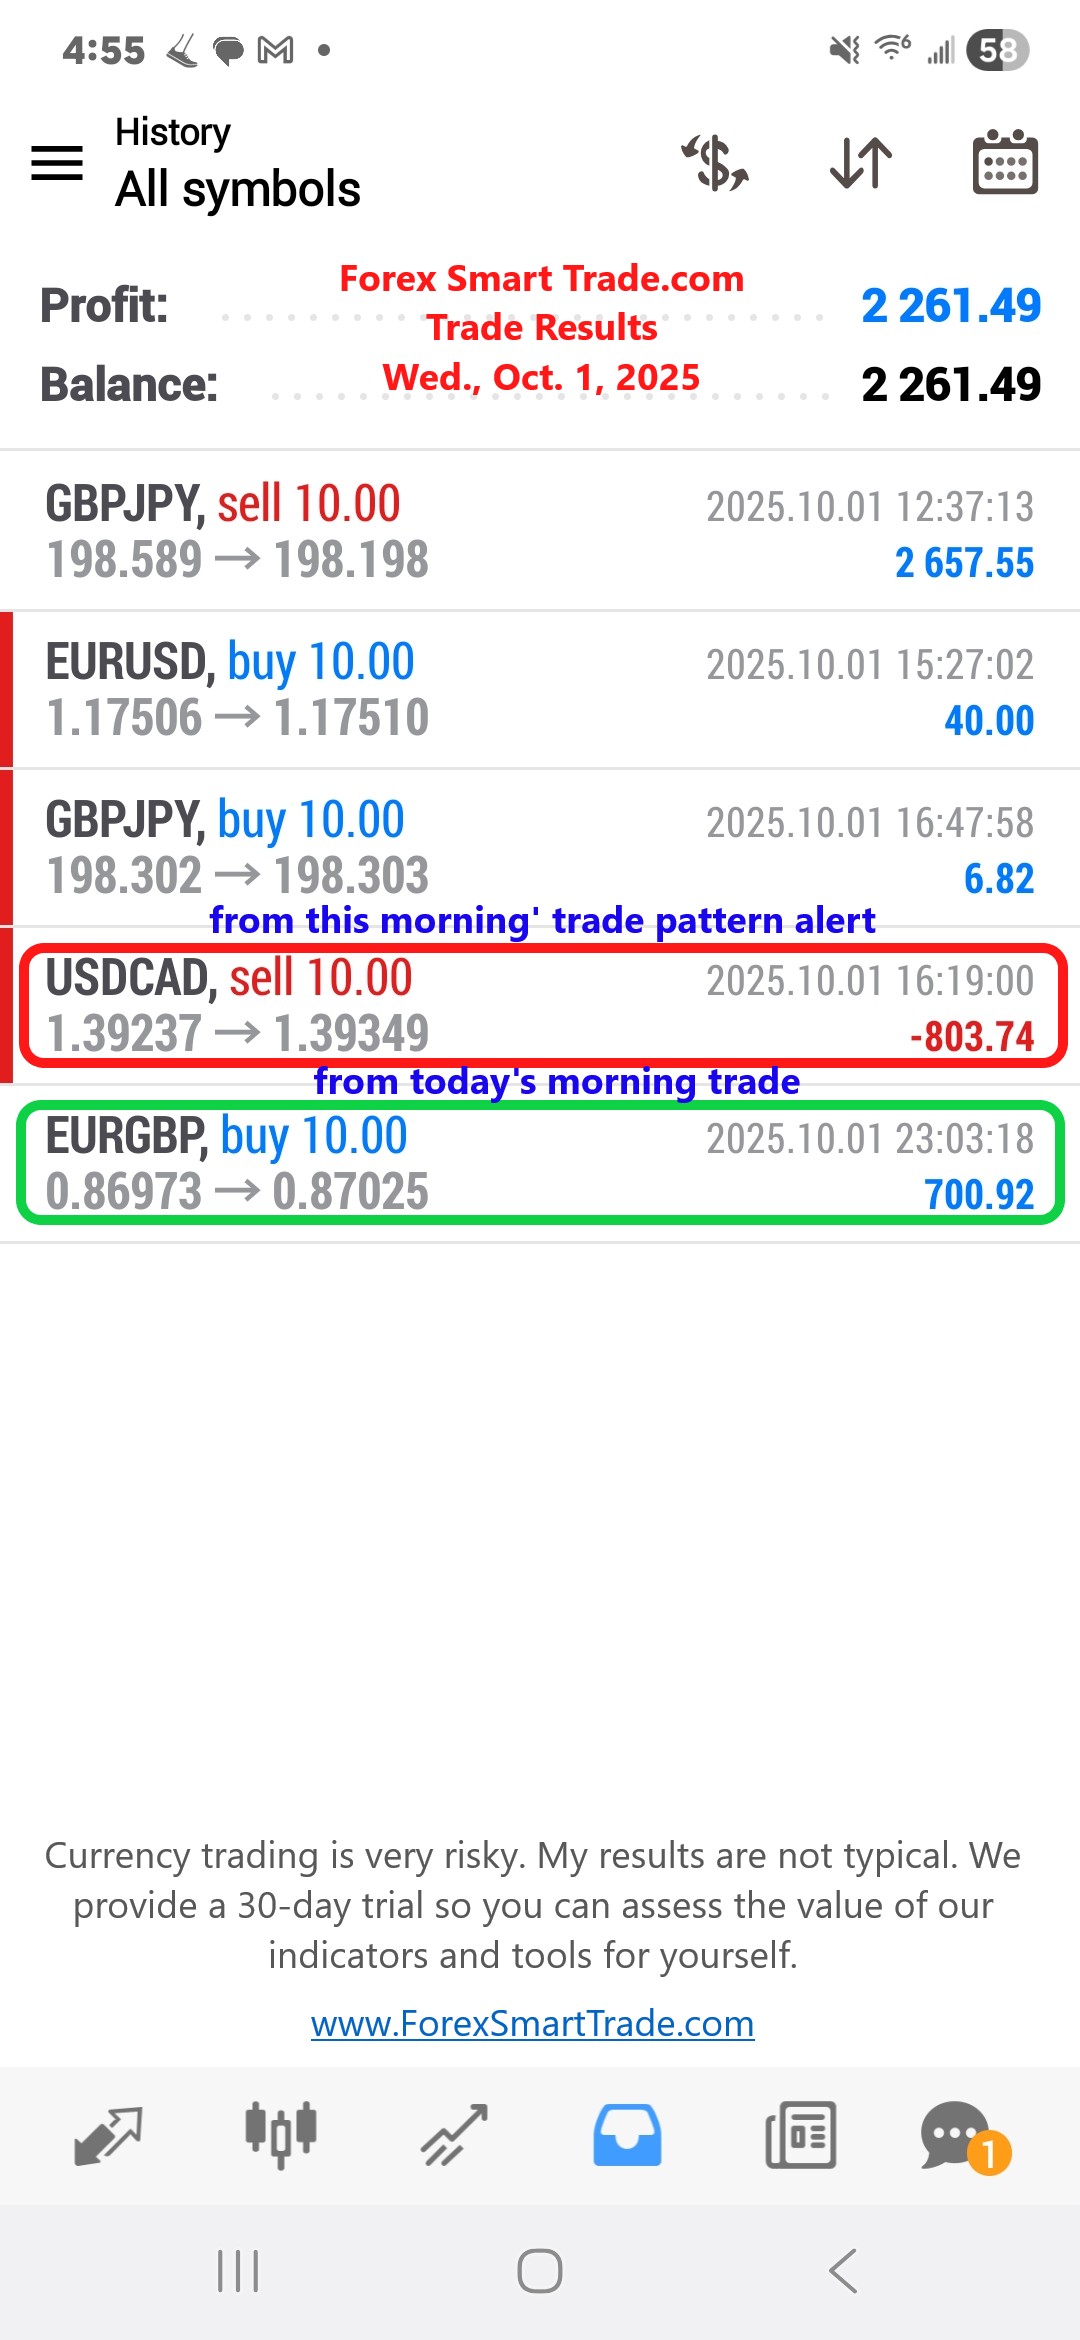
Trade Results. Wed., Oct. 1, 2025: $2,262
The Top 10 +1 Daily Targets That Separate Consistent Winners from Inconsistent Losers. Exceptional traders don’t leave success to chance. That’s why the most profitable traders […]
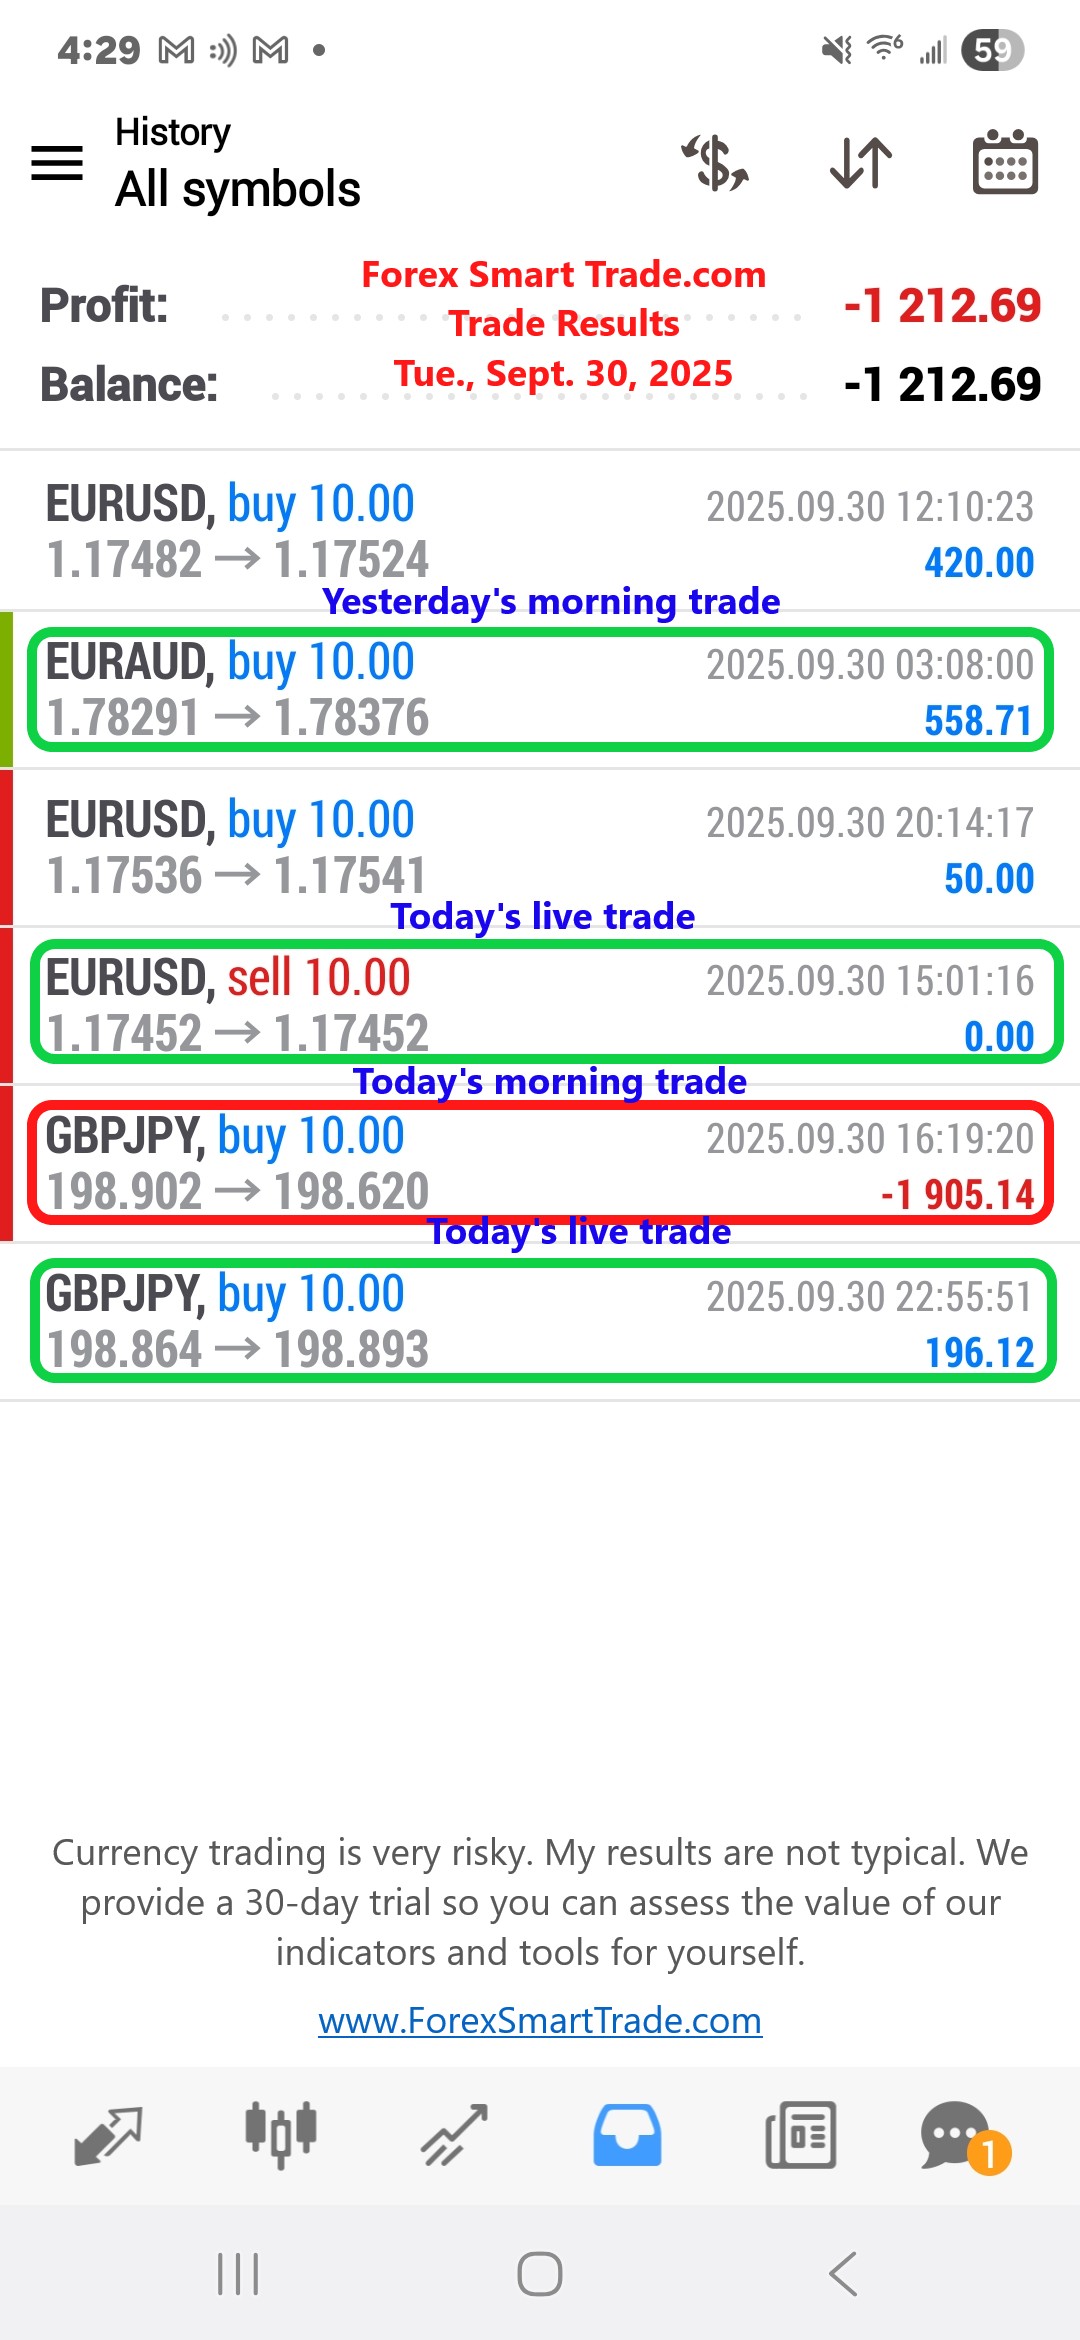
Trade Results. Tue., Sept. 30, 2025: ($1,212)
The Growth Mindset Secret That Turns Losing Traders into Profitable Ones (Michael Jordan’s Lesson Applied to Trading). Carol Dweck, author of Mindset: The New Psychology of […]
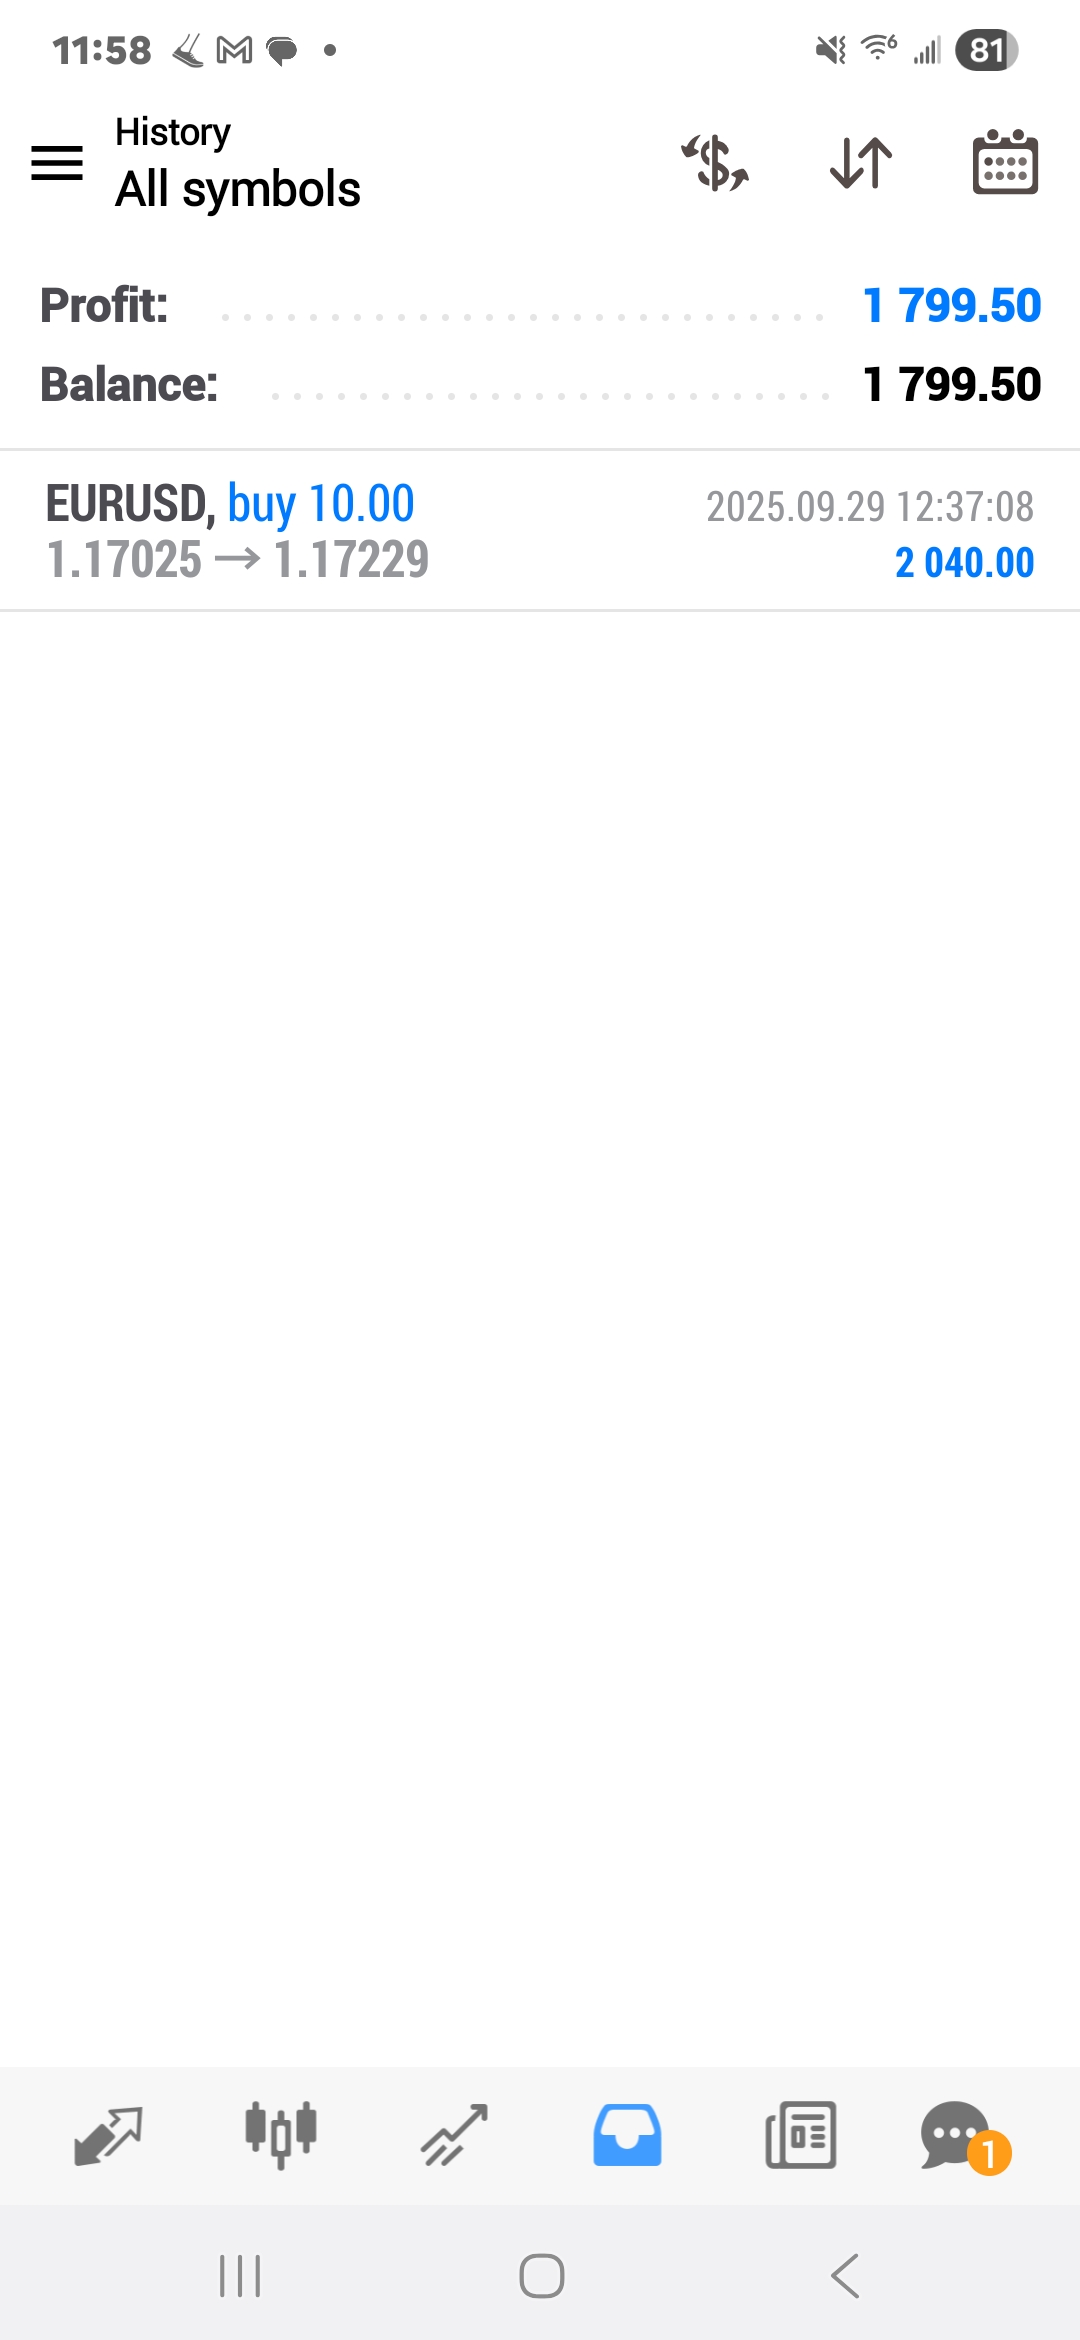
Trade Results. Mon., Sept. 29, 2025: $1,799
💸 Stop Losing Money on Trading “Secrets” – Start Earning More While Working Less. Tired of trading courses that promise everything and deliver nothing? You’re not […]
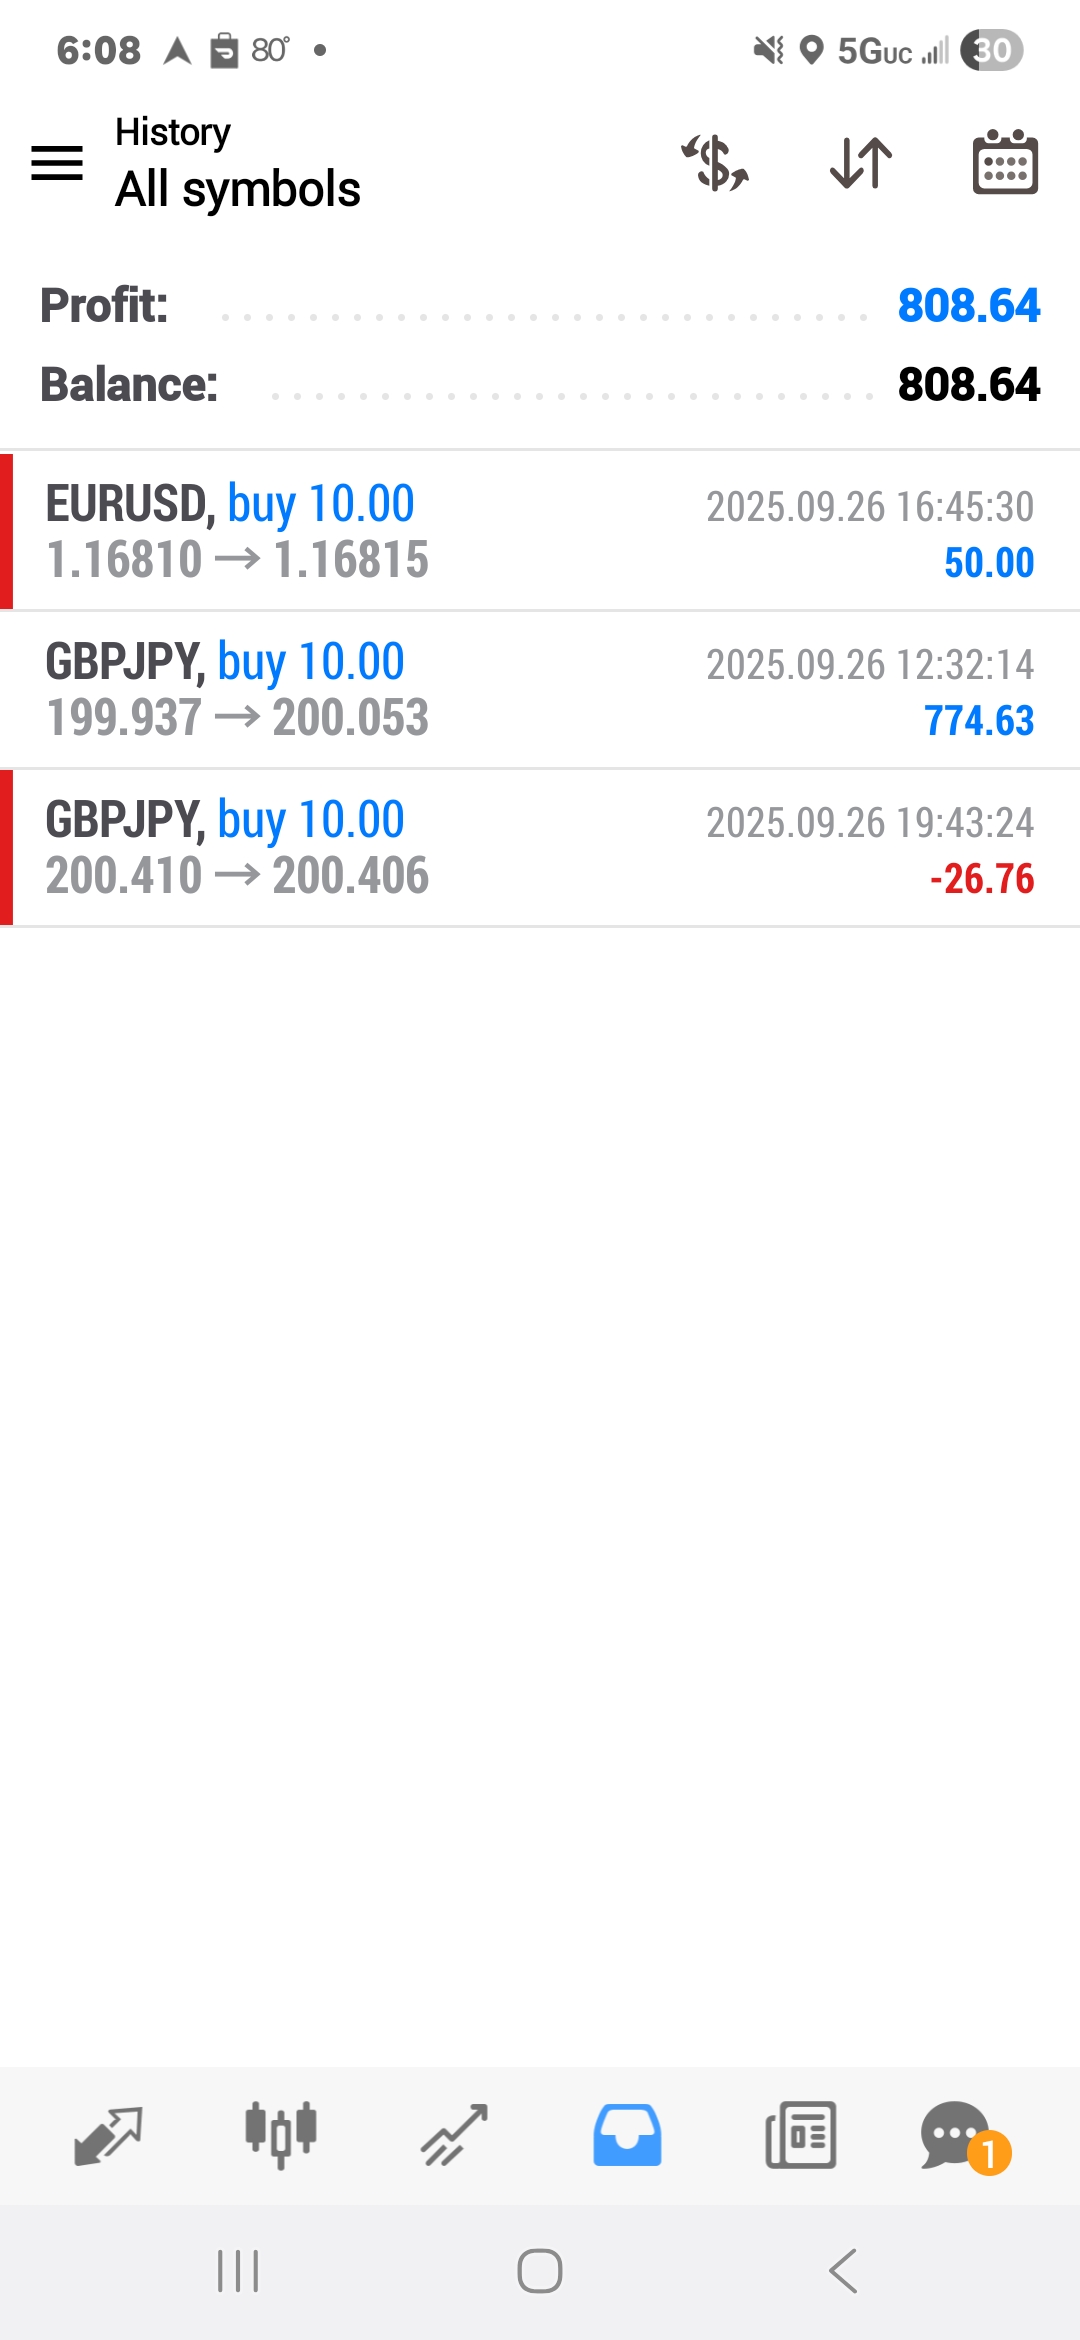
Trade Results. Fri., Sept. 26, 2025: $808
Stop Losing Money on Trading “Secrets” – Start Earning More While Working Less. Tired of trading courses that promise everything and deliver nothing? You’re not alone. […]
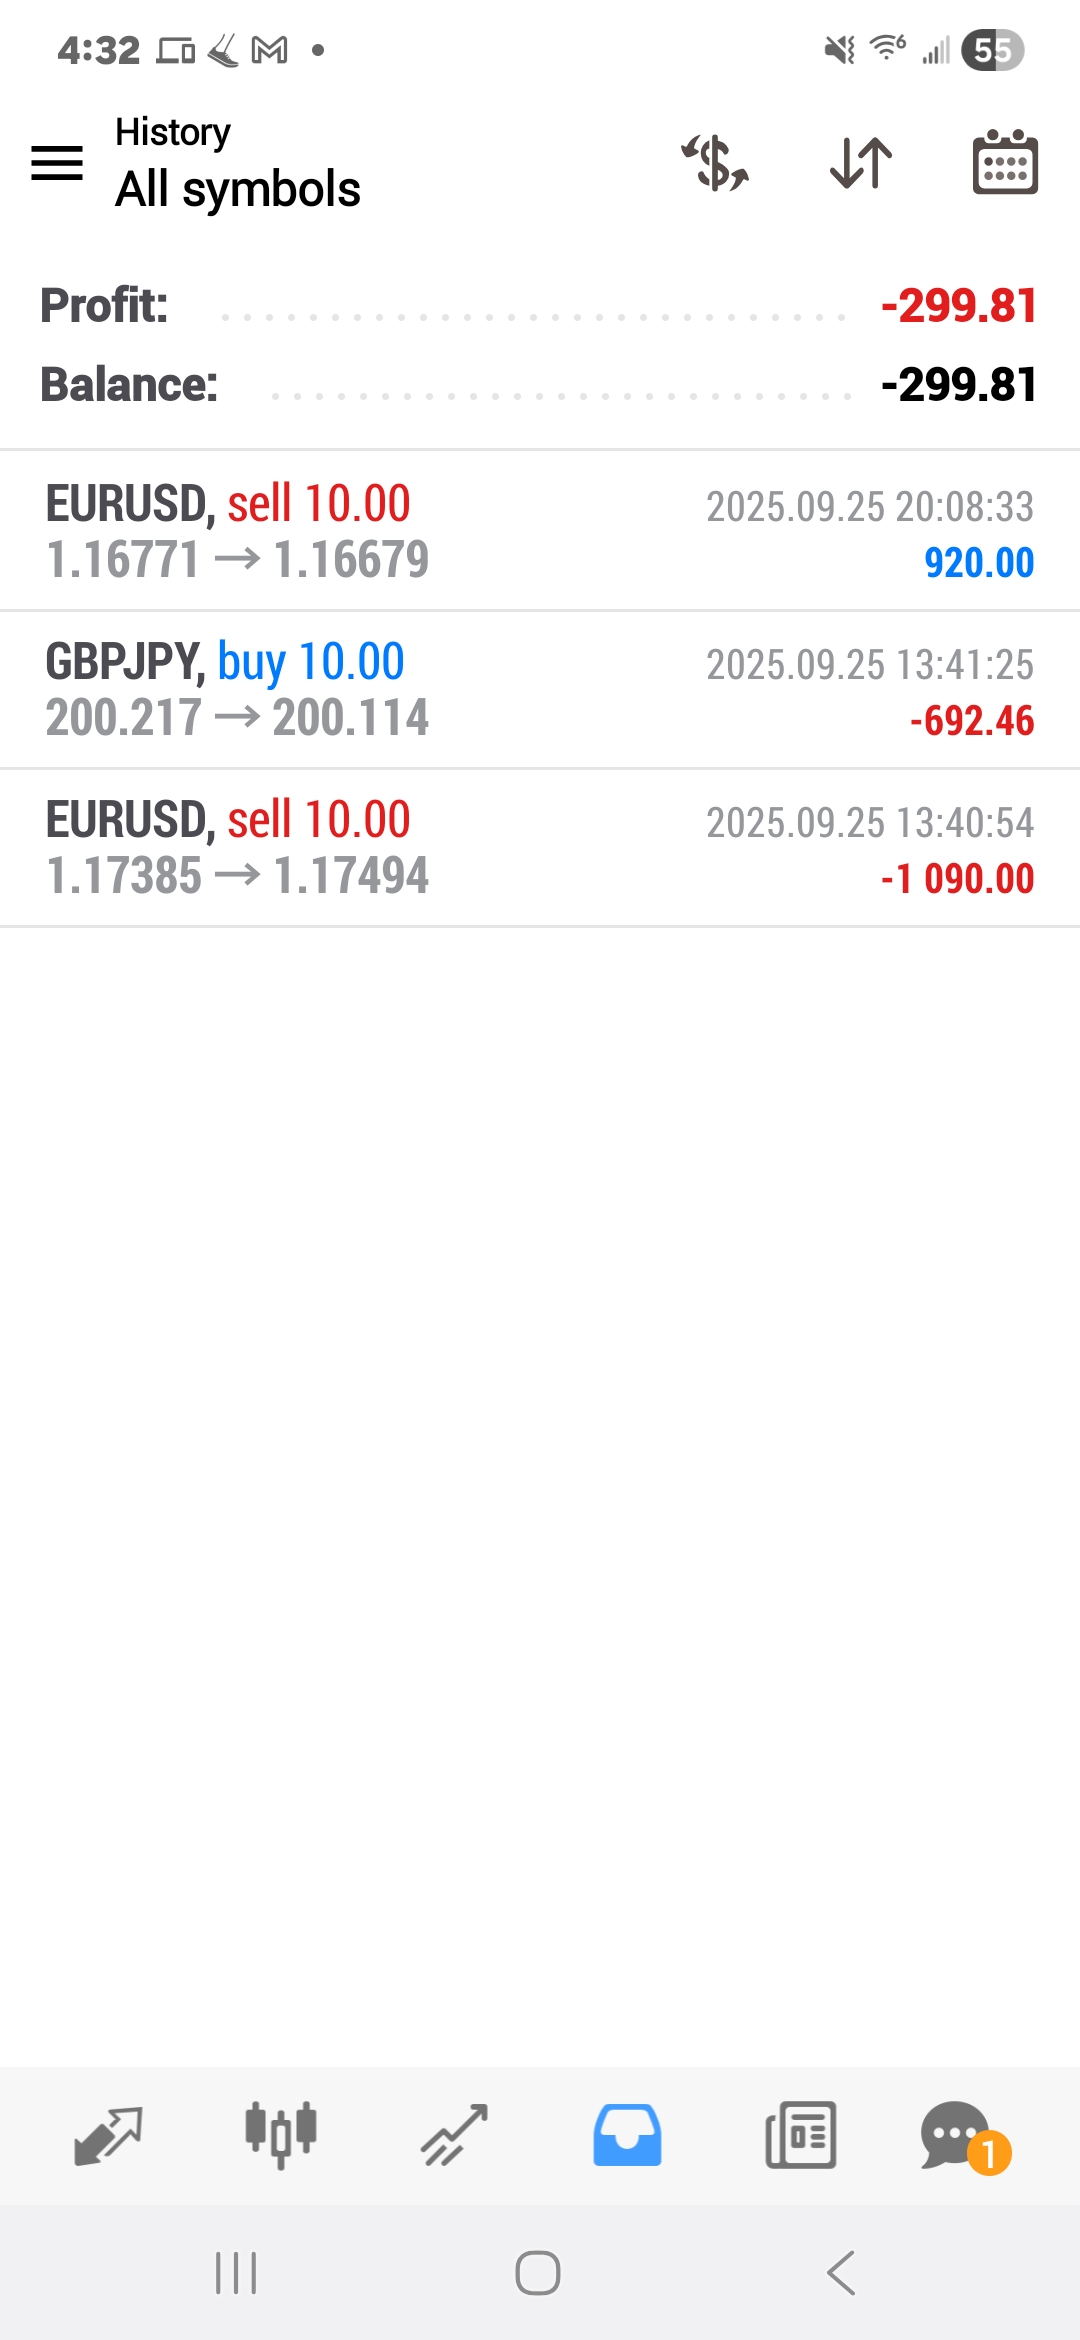
Trade Results. Thur., Sept. 25, 2025: ($299)
💸 Stop Losing Money on Trading “Secrets” – Start Earning More While Working Less. Tired of trading courses that promise everything and deliver nothing? You’re not […]
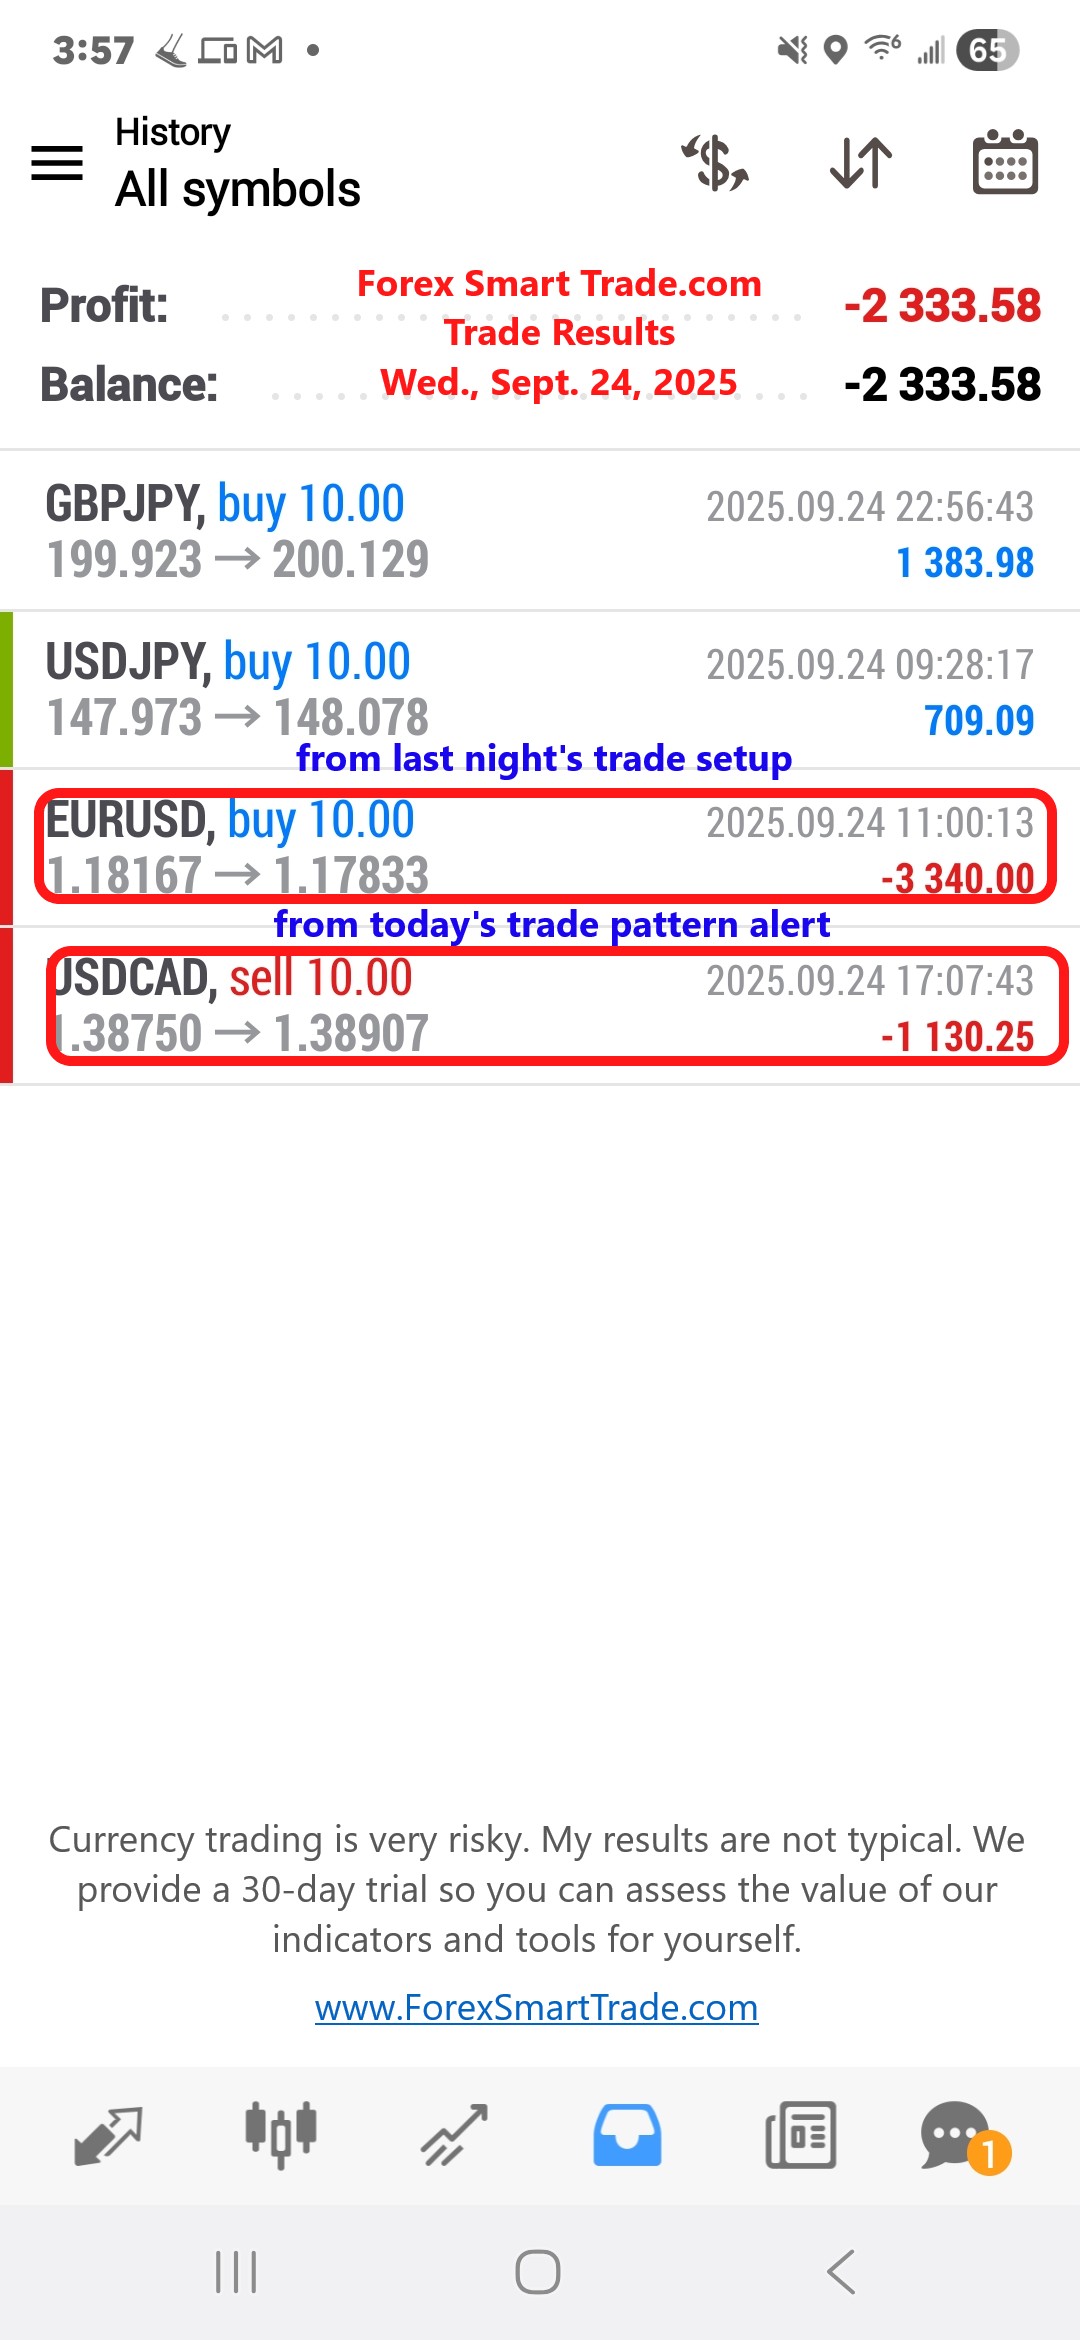
Trade Results. Wed., Sept. 24, 2025: ($2,333)
The Confidence Paradox That Keeps Most Traders Broke (And How to Fix It Today). Today’s wisdom comes from The Confidence Gap by Dr. Russ Harris. Russ […]
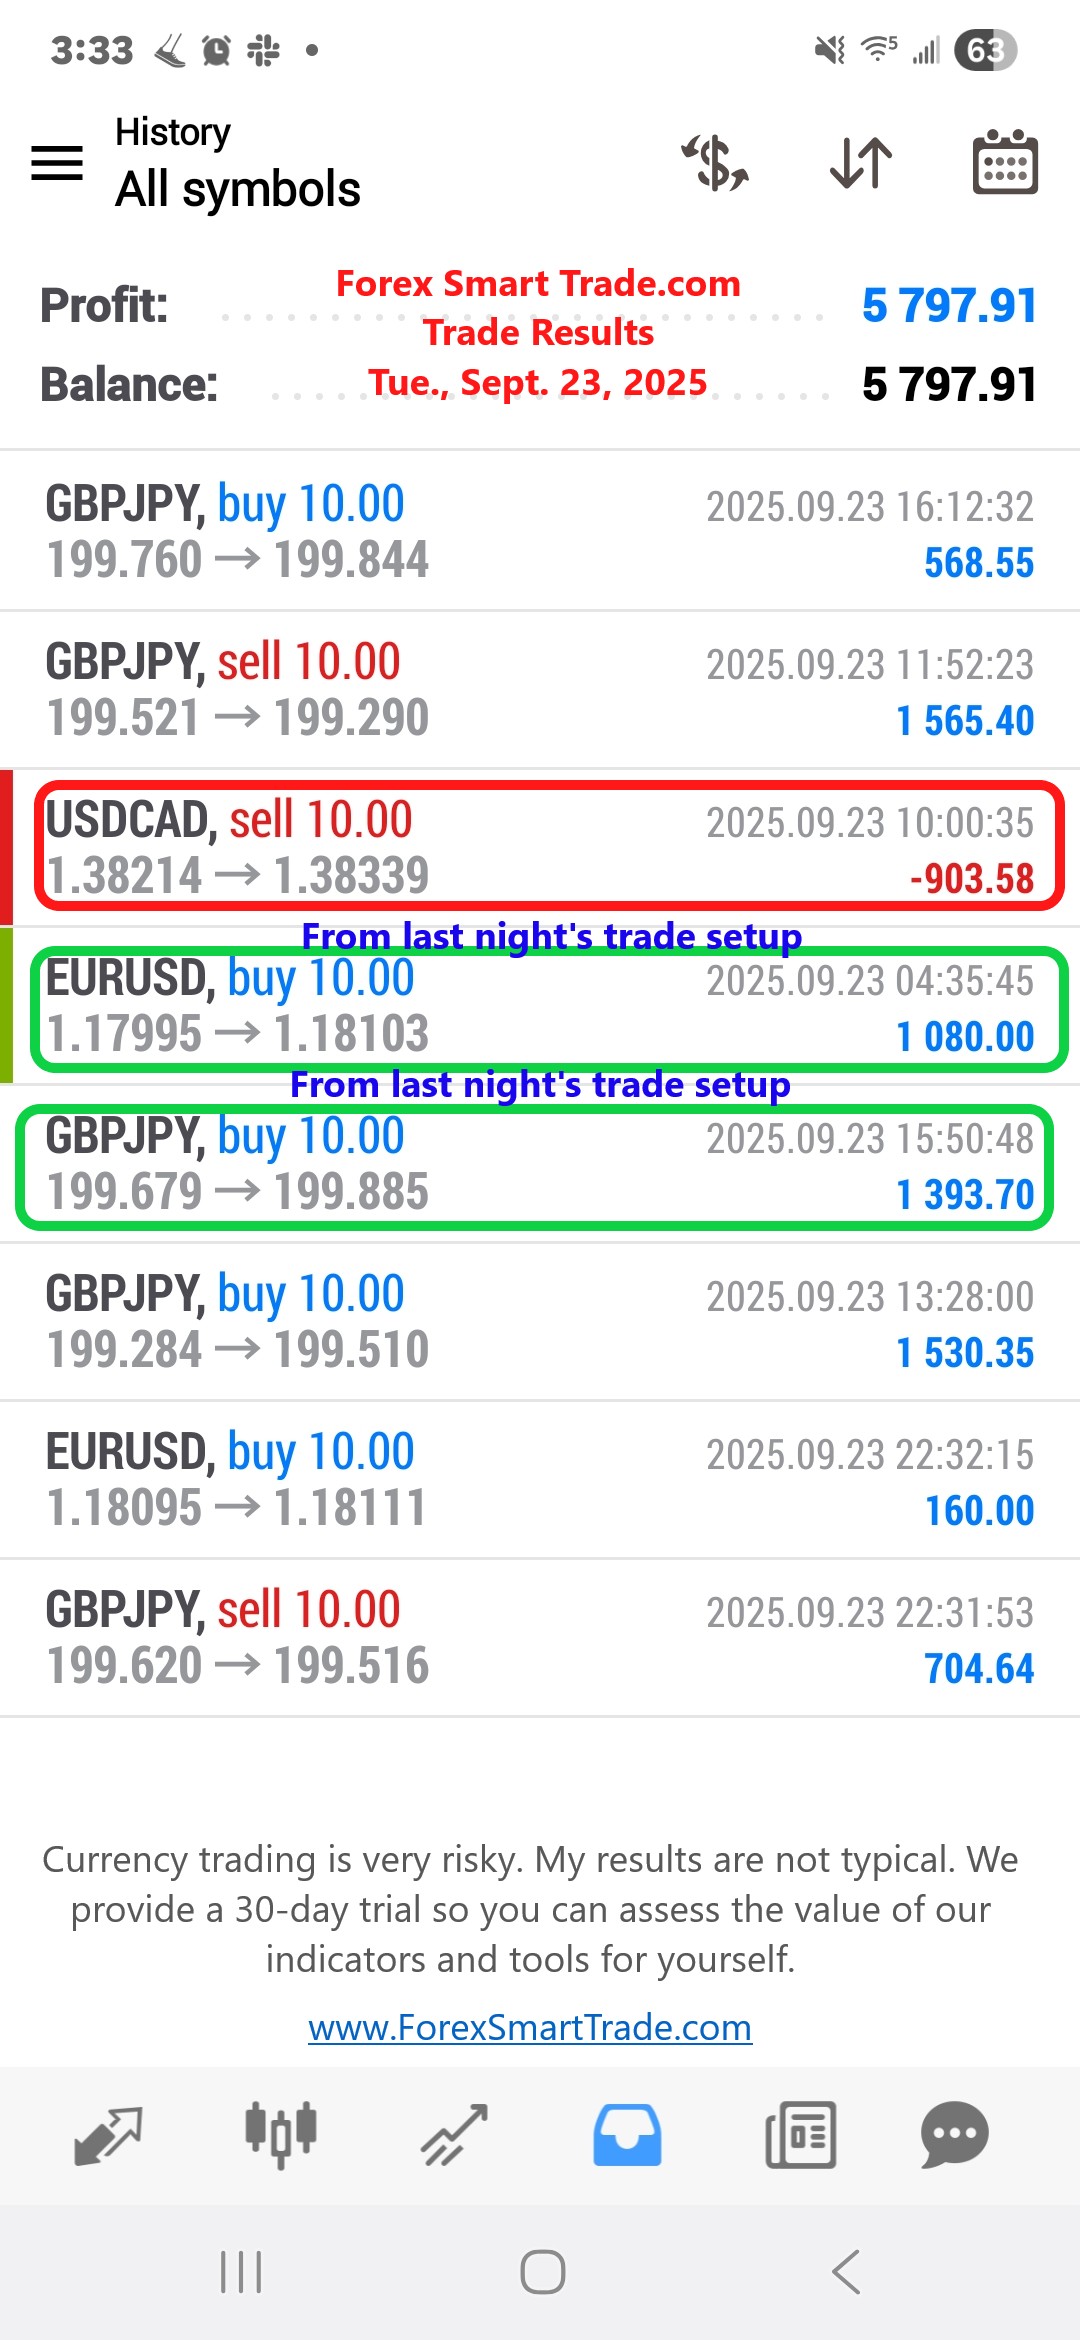
Trade Results. Tue., Sept. 23, 2025: $5,797
The 5 Energy Fundamentals That Transform Losing Traders into Winning Machines. If you want to master your trading, you need to master your energy. When you […]
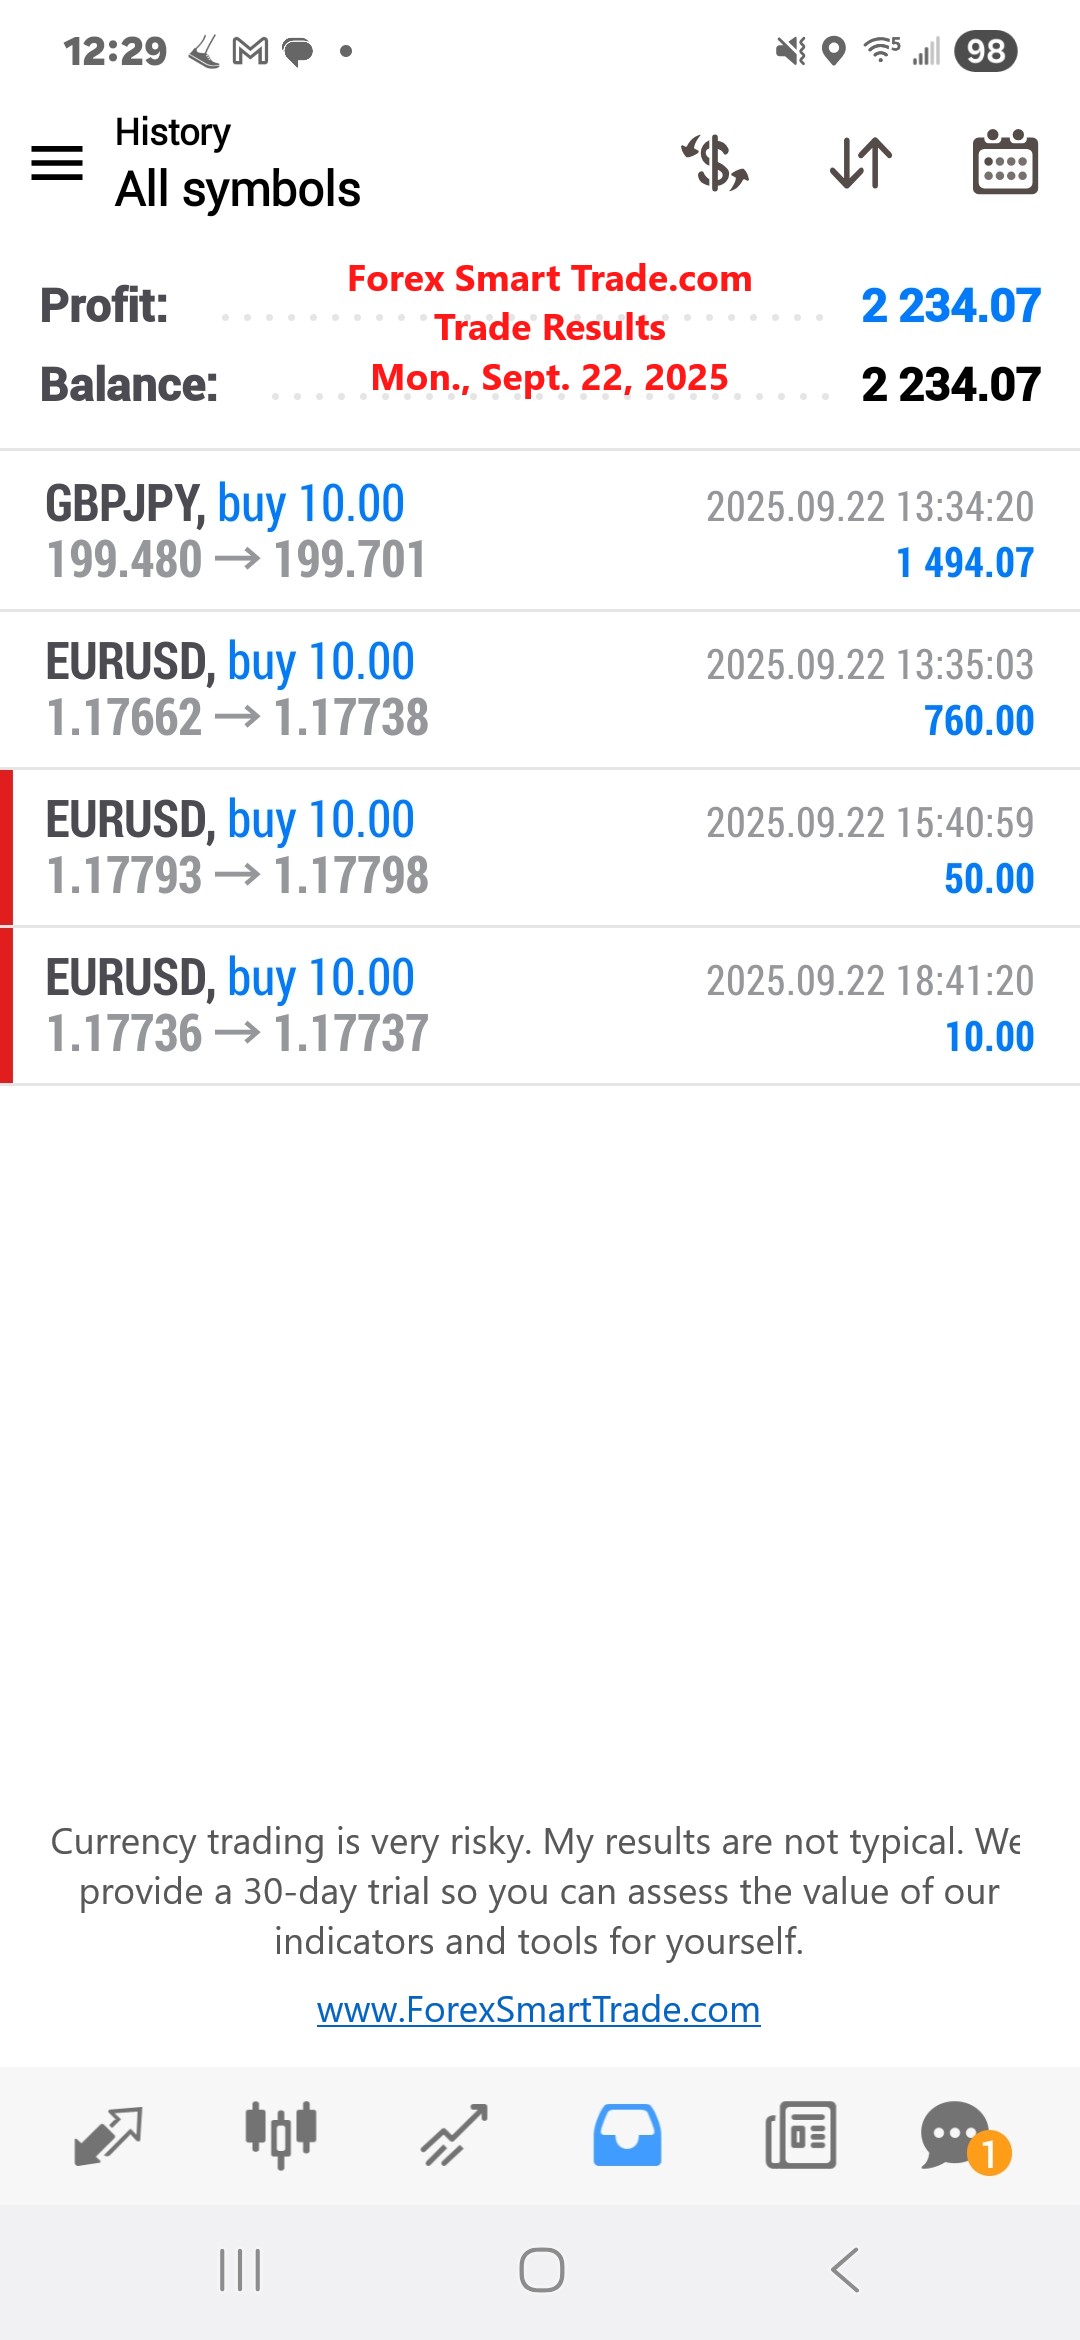
Trade Results. Mon., Sept. 22, 2025: $2,234
The Amateur vs. Pro Trader: Why Most People Never Make It Past Day One. Today’s wisdom is from Turning Pro by Steven Pressfield—one of my all […]
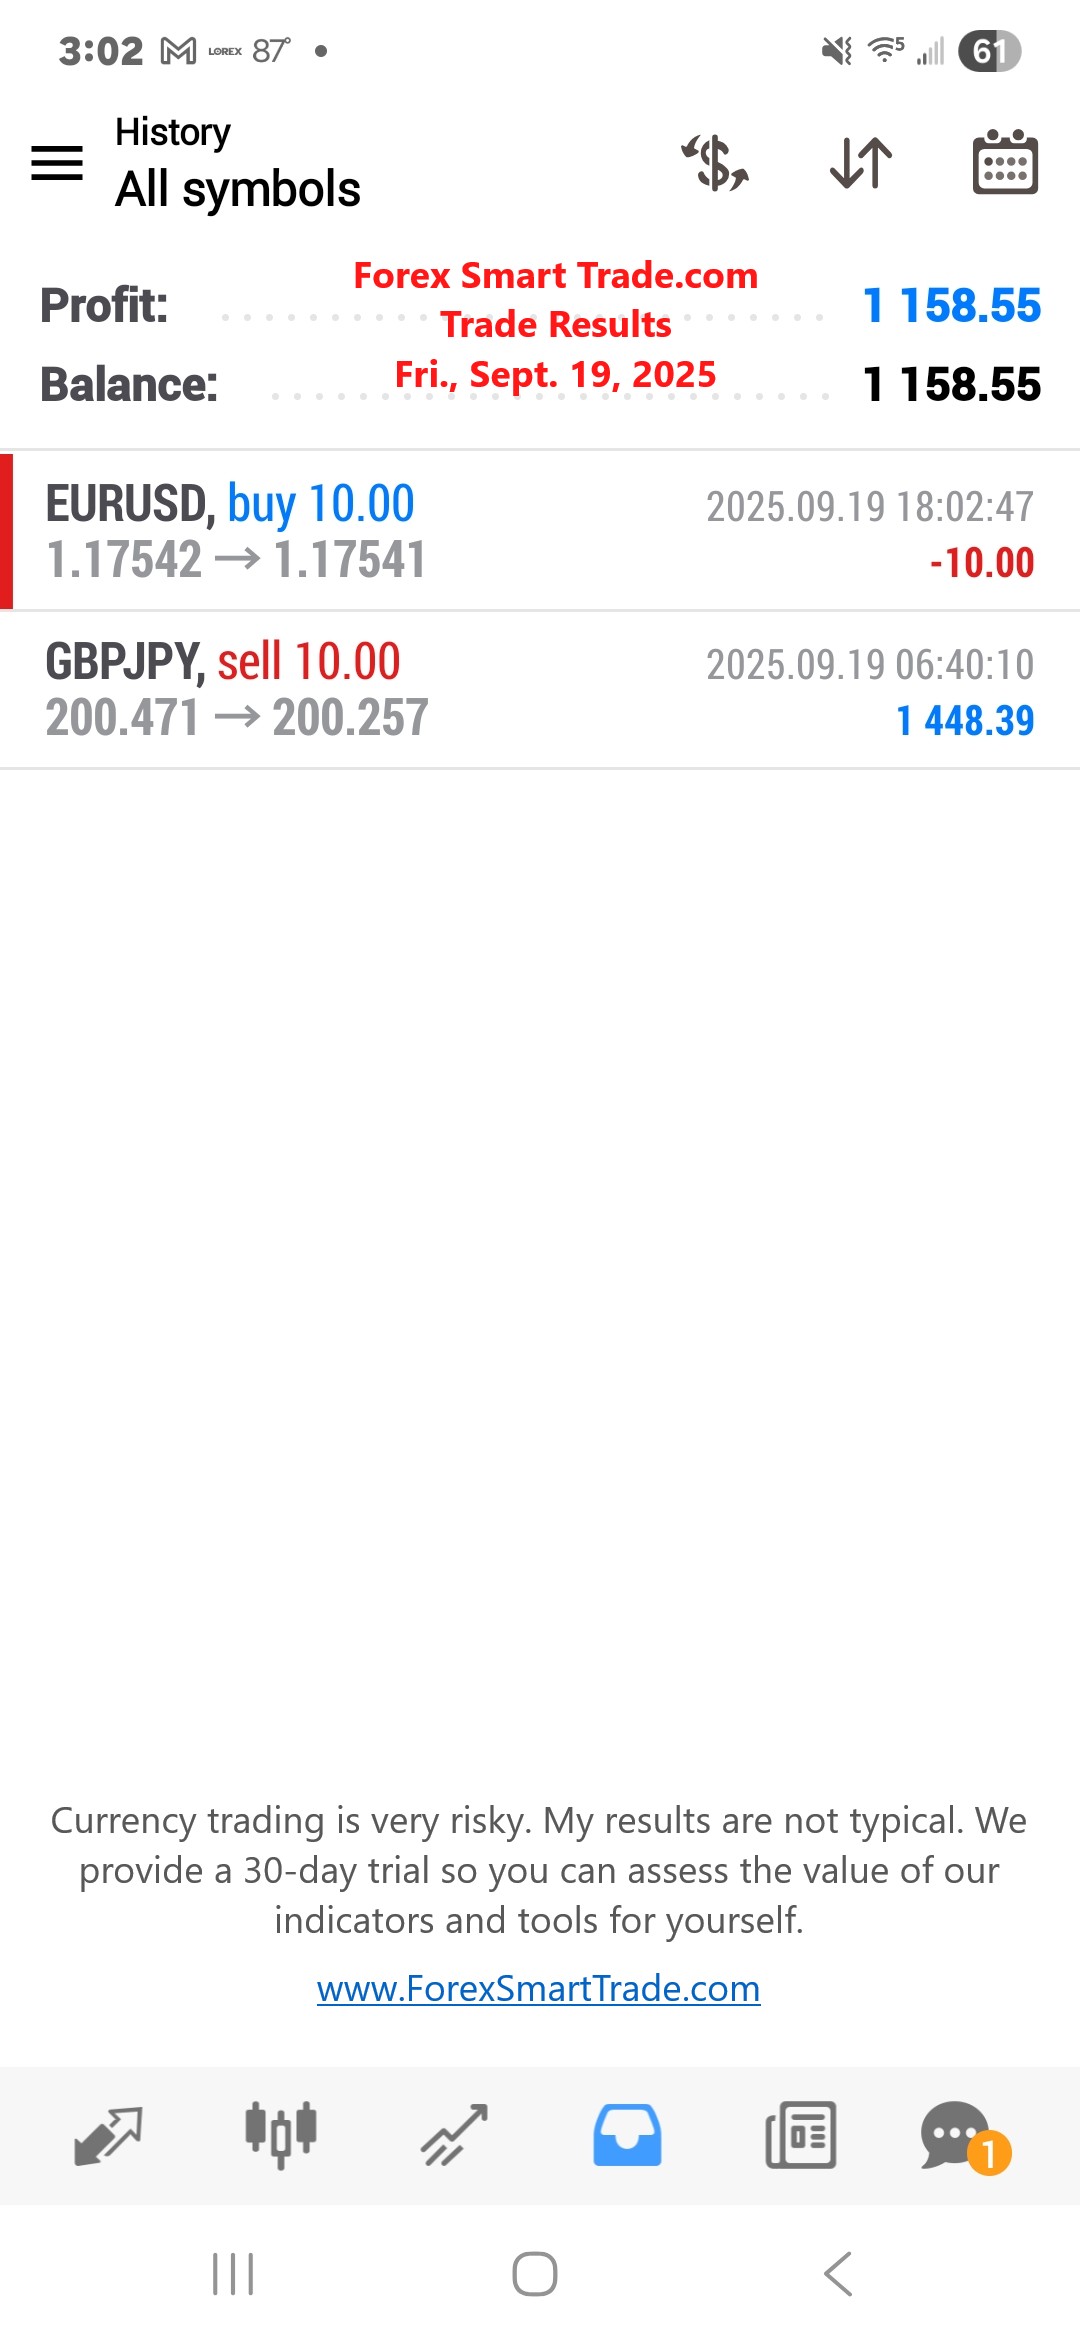
Trade Results. Fri., Sept. 19, 2025: $1,158
💸 Stop Losing Money on Trading “Secrets” – See Real Results for $10. Tired of trading courses that promise everything and deliver nothing? You’re not alone. […]
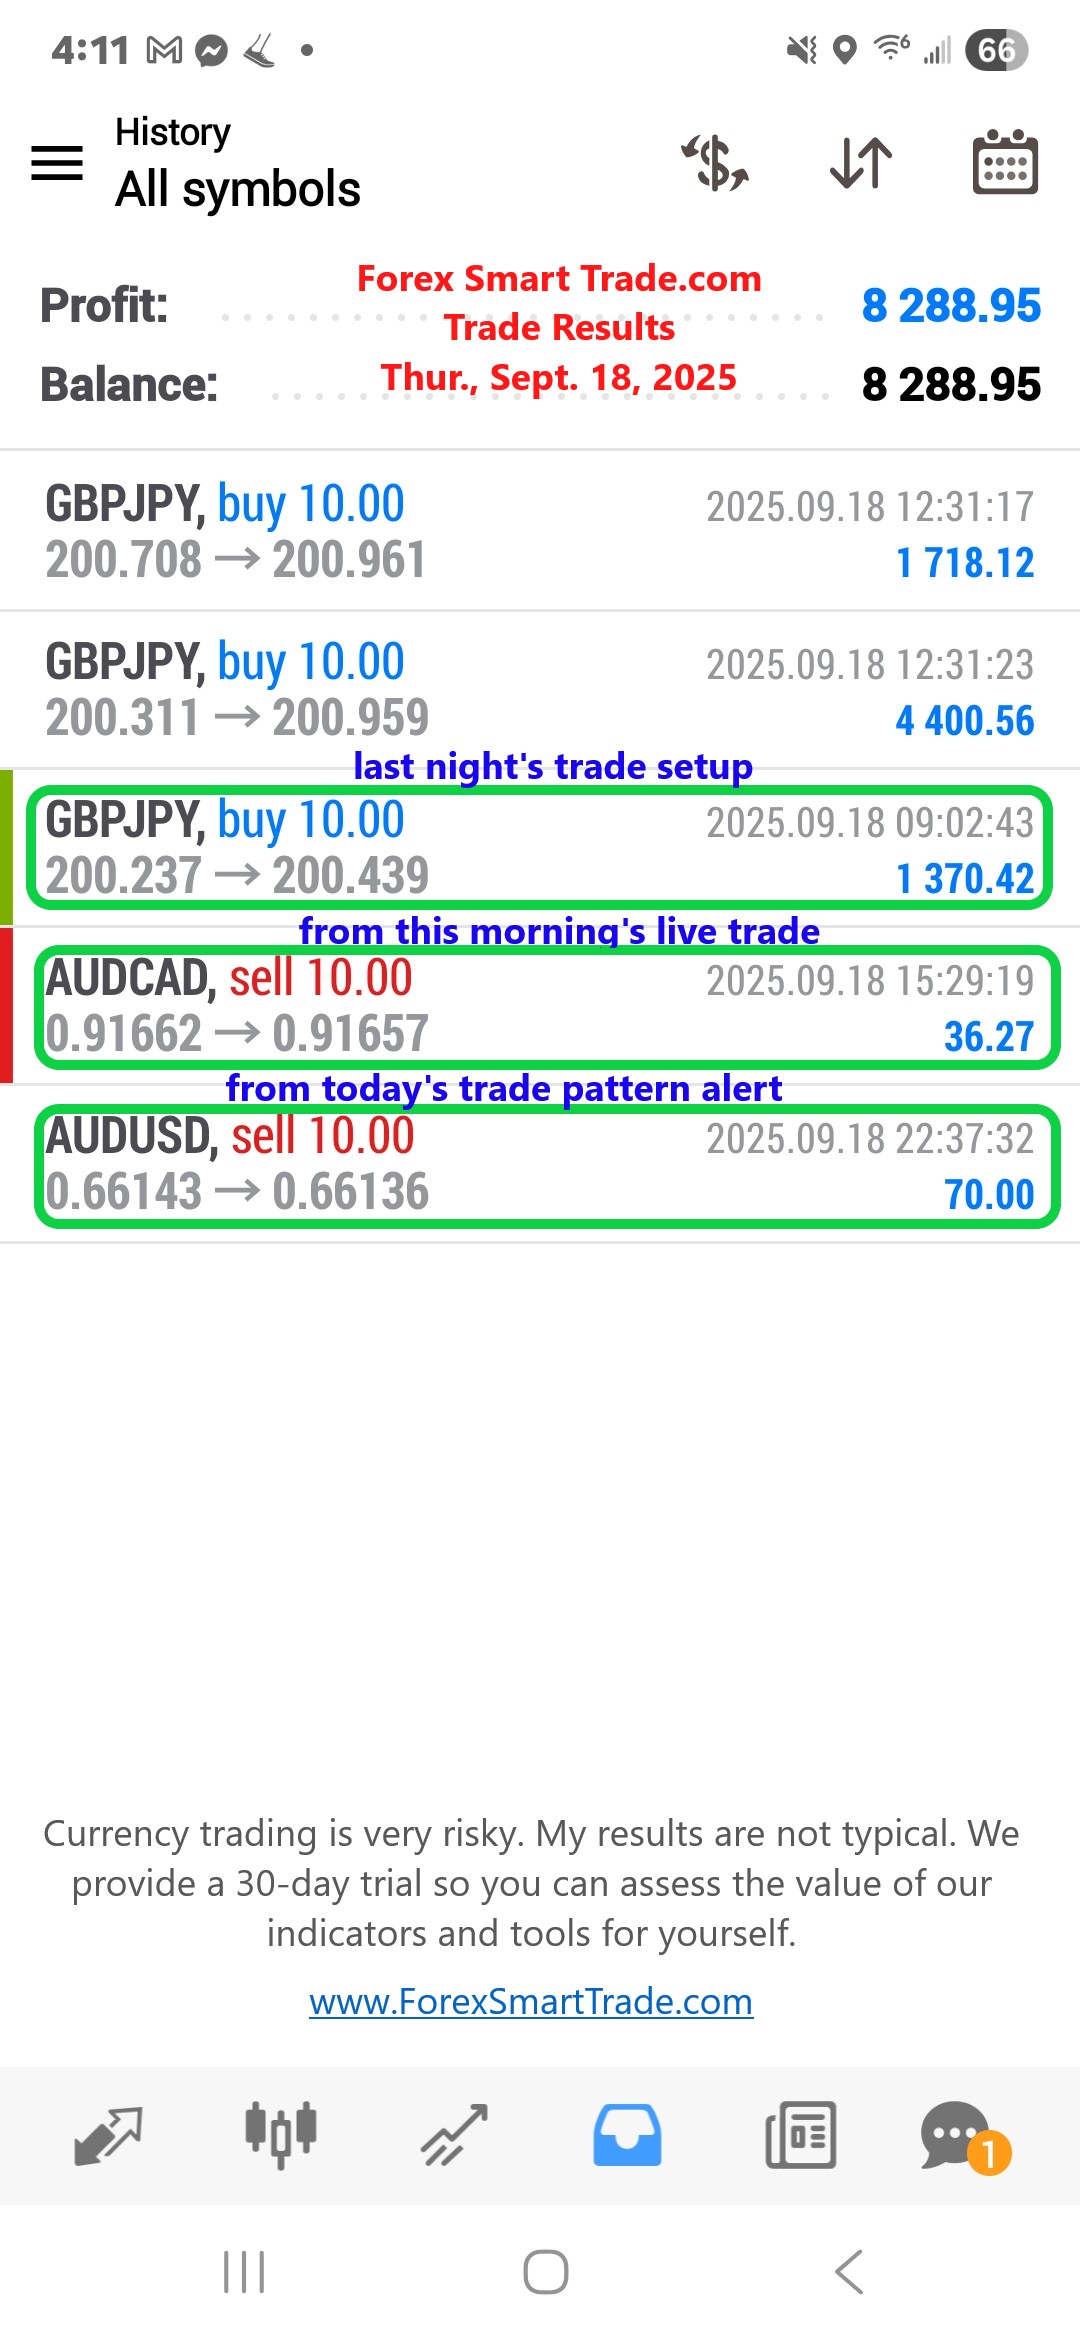
Trade Results. Thur. Sept. 18, 2025: $8,288
The Trading “Cheese” That Disappeared: Why Most Traders Are Still Searching in the Wrong Maze. Have you ever read the book Who Moved My Cheese? by […]
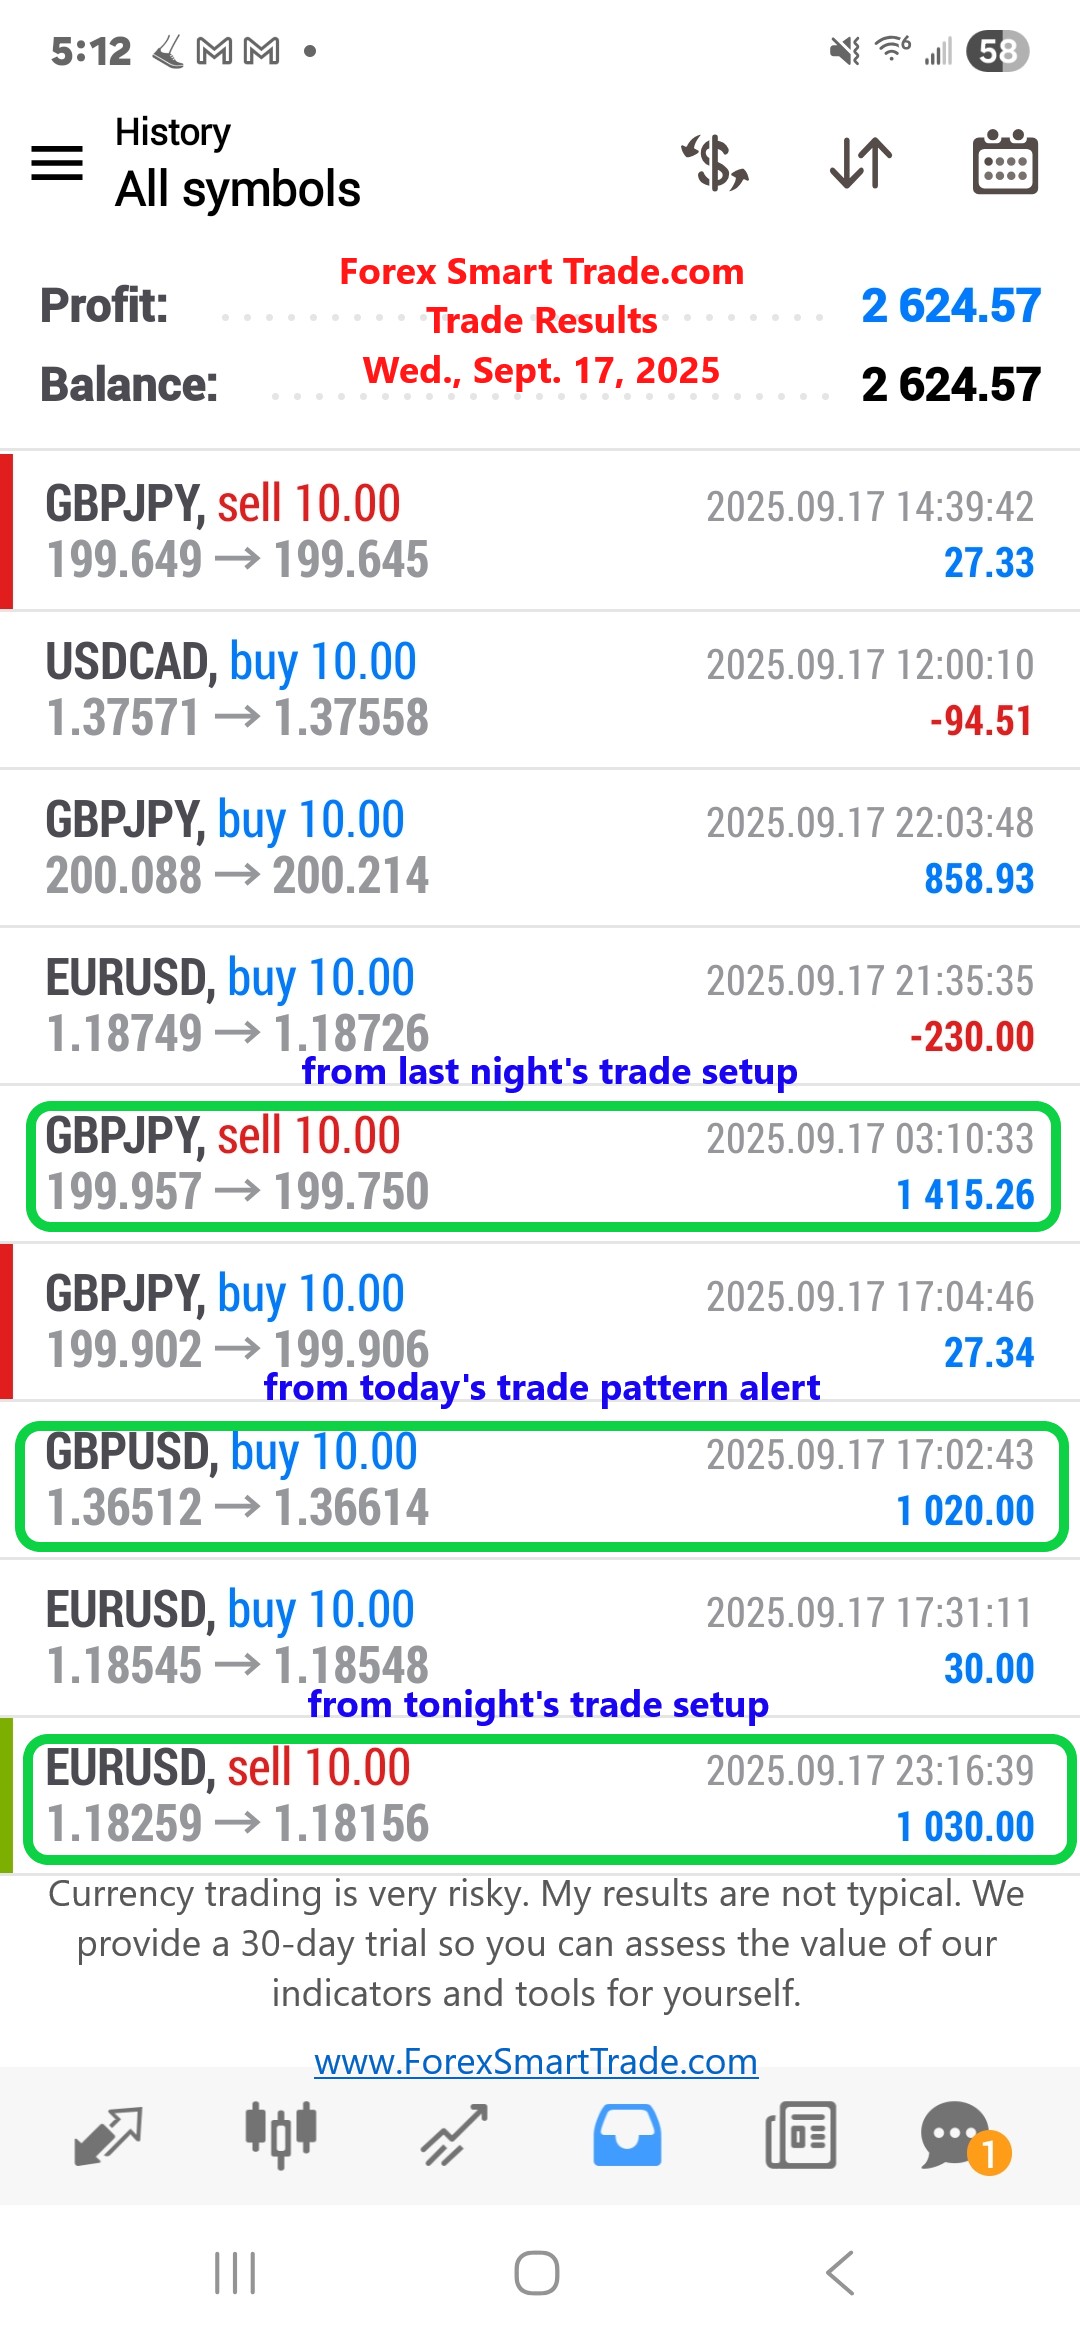
Trade Results. Wed., Sept. 17, 2025. $2,624
The $16,000 Phone Call That Changed Everything (And Why Trading Skills Matter More Than You Think). Did you know you can die from a toothache? When […]
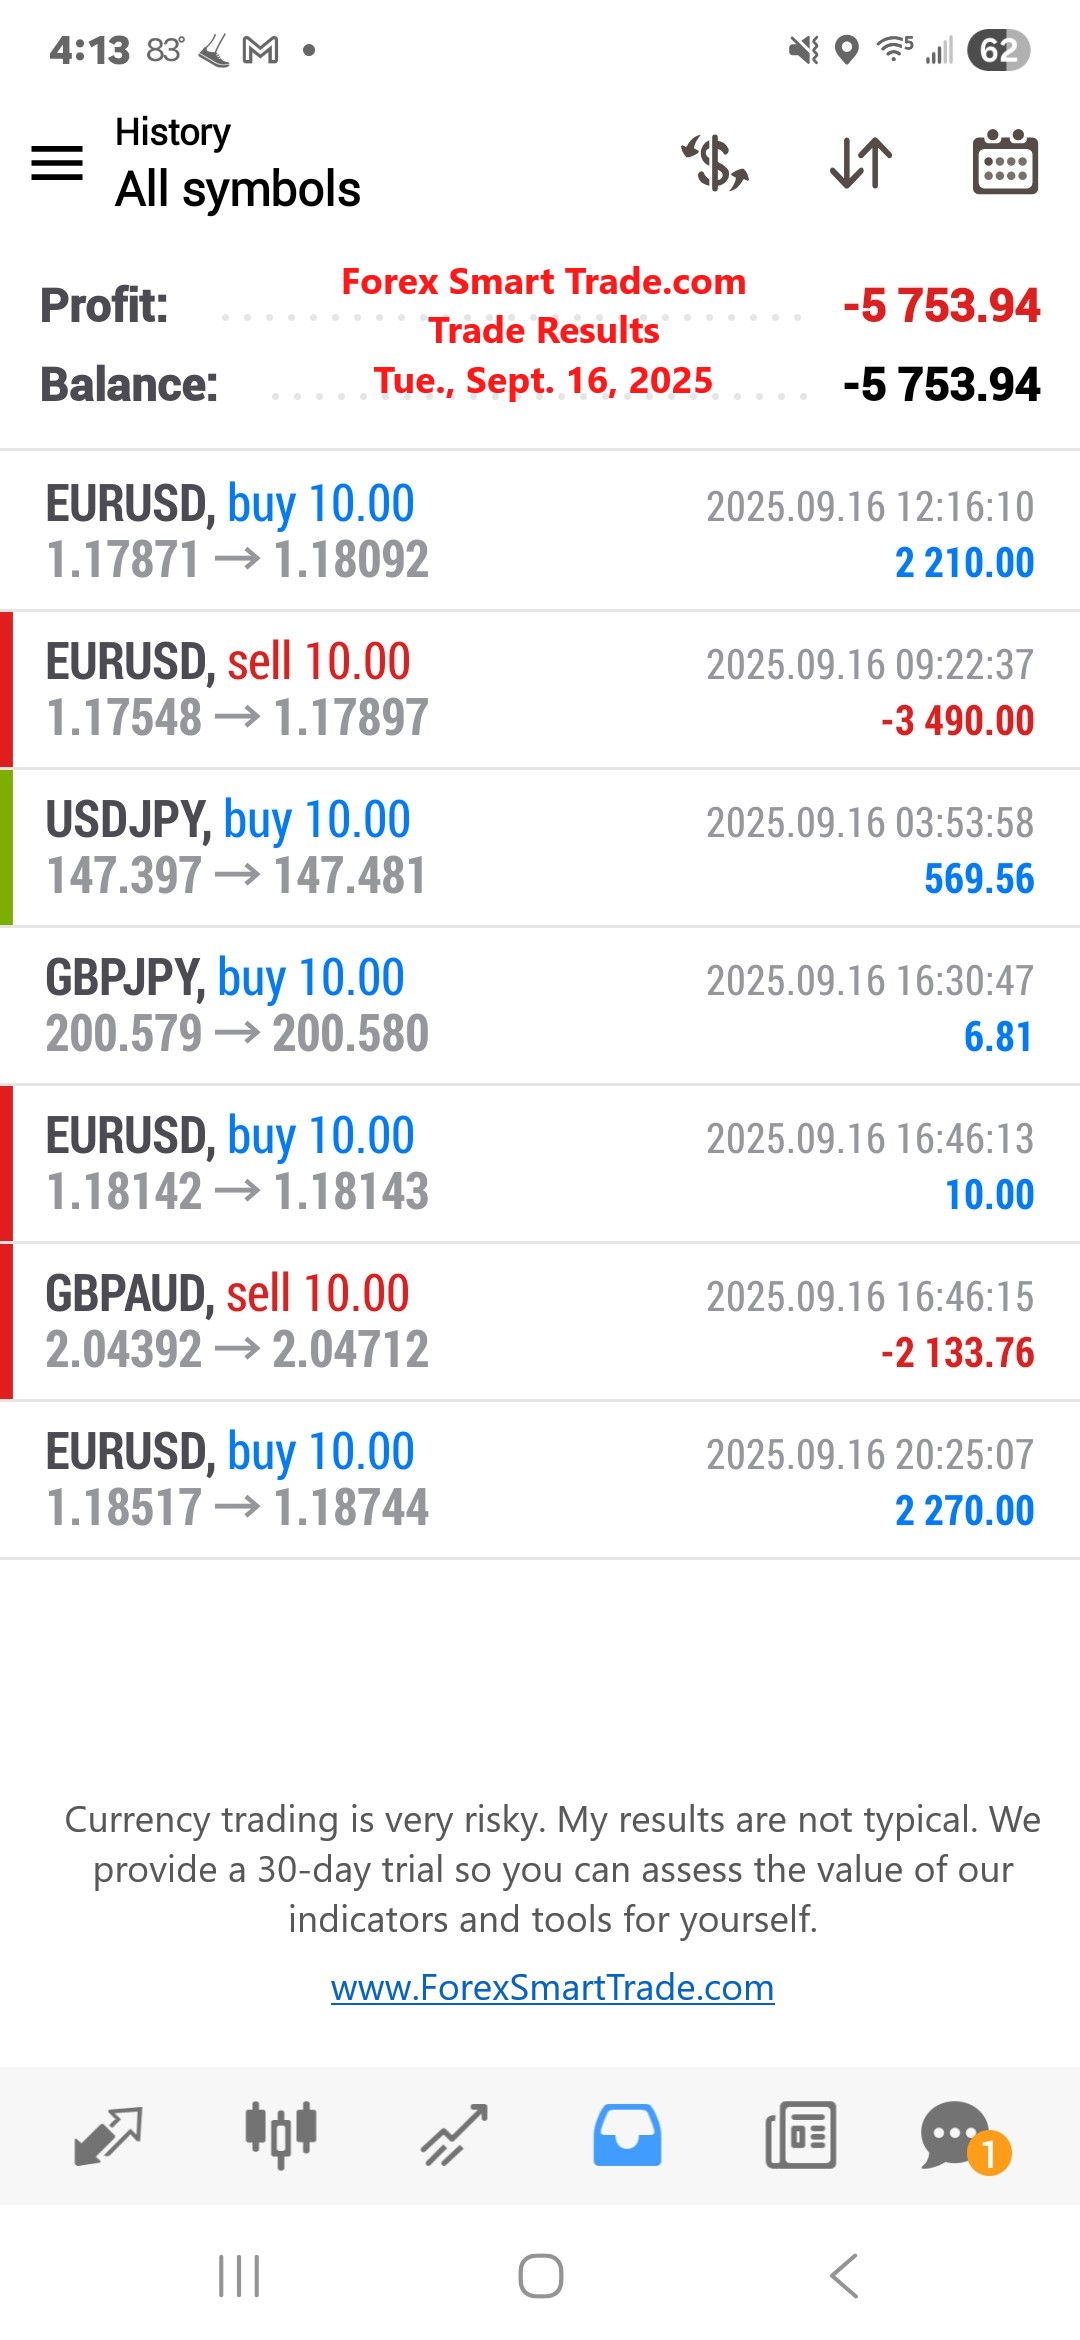
Trade Results. Tues., Sept. 16, 2025: ($5,753)
Foundation vs. Elite: The Trading Mindset That Separates Consistent Winners from Perfection Chasers. At Forex Smart Trade, we’re not interested in perfection—we’re interested in progress. That’s […]
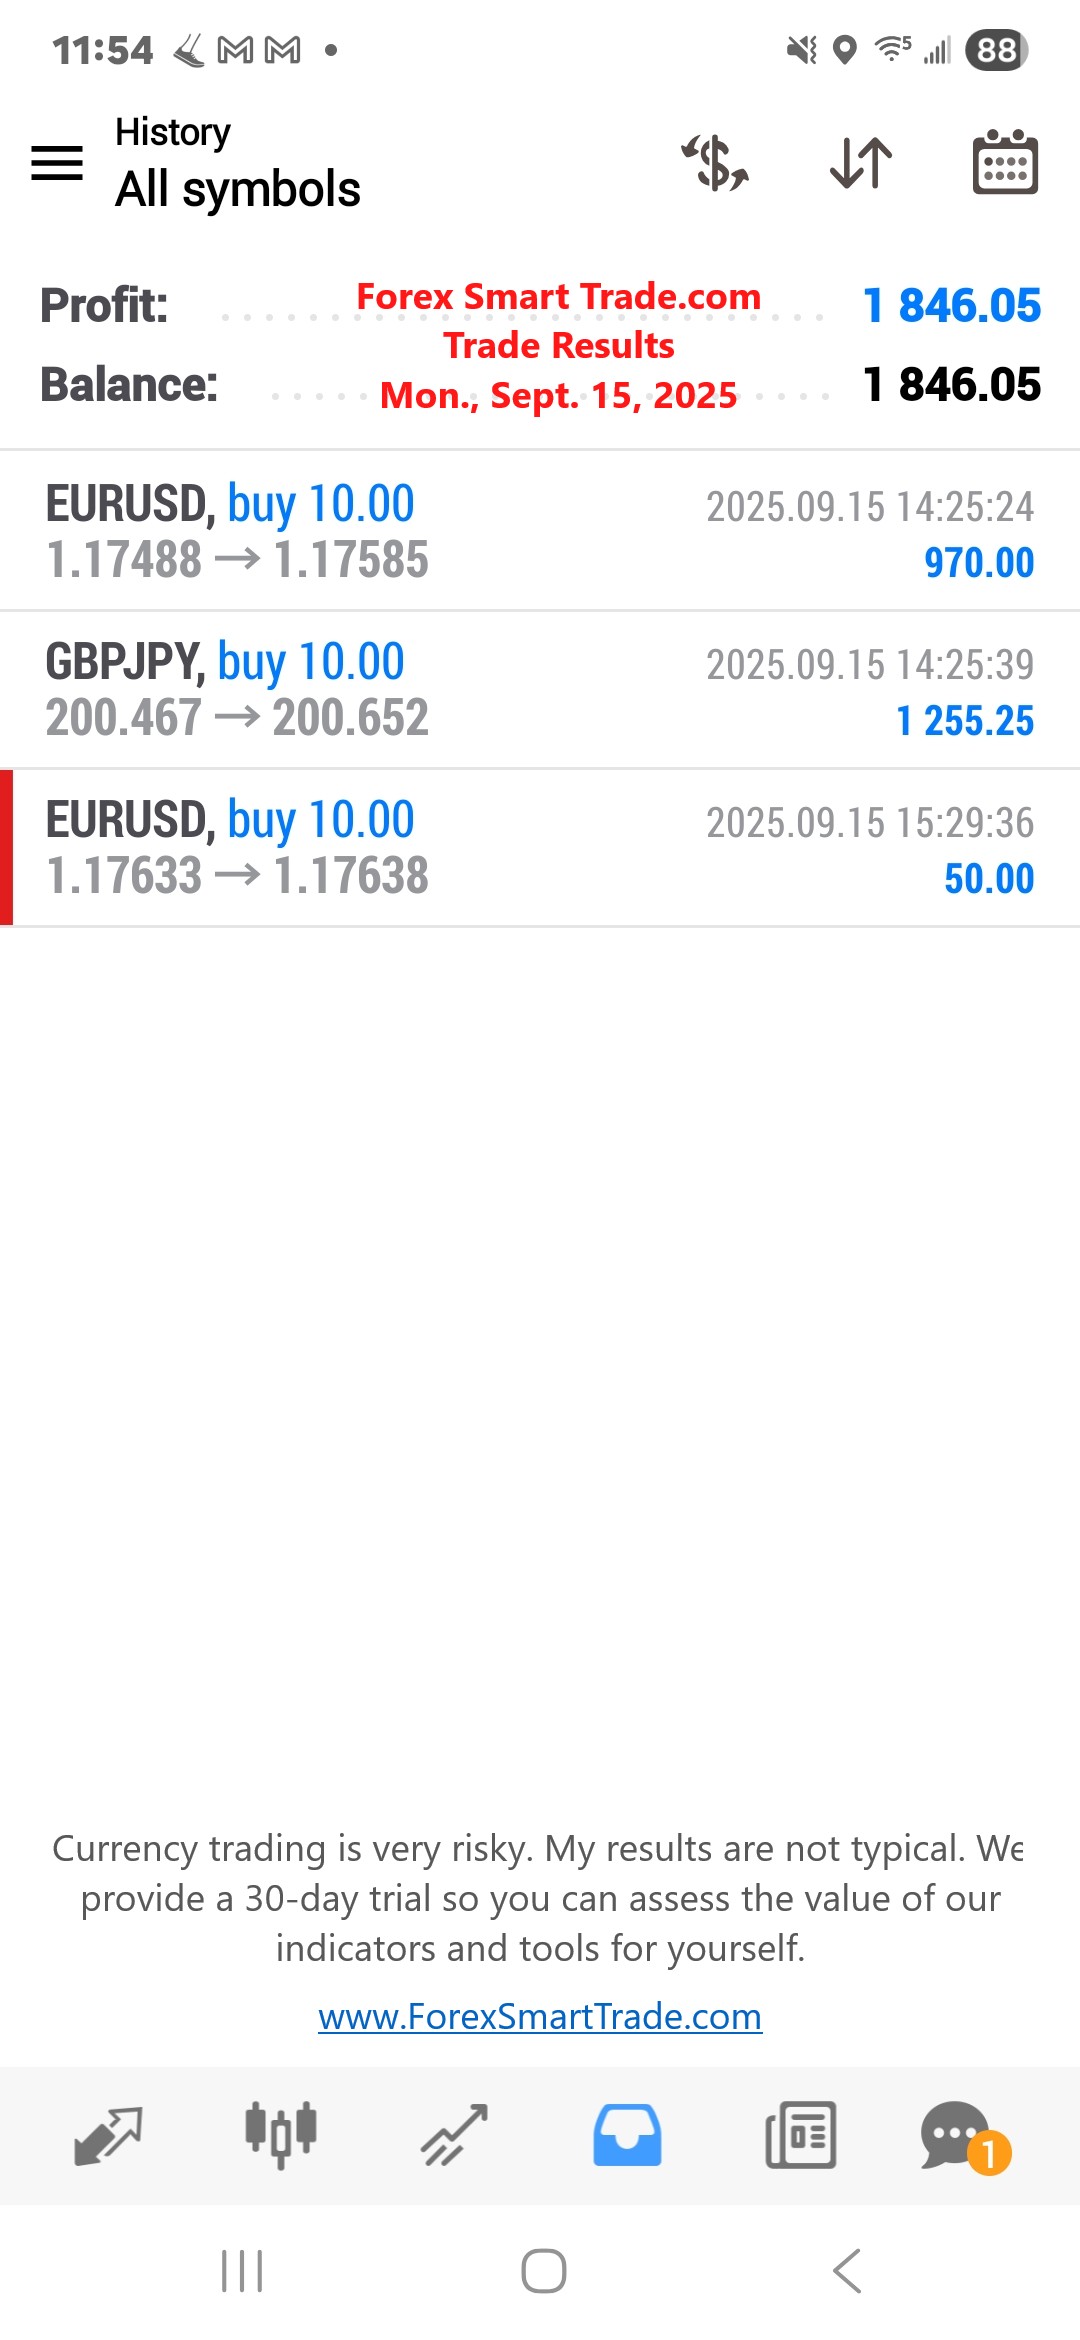
Trade Results. Mon., Sept. 15, 2025. $1,846
The Hidden Job Market Crisis That Makes Trading Skills Essential (Wall Street Journal Data Reveals Shocking Truth). The Wall Street Journal just published data that should […]
Trade Results. Fri., Sept. 12, 2025: ($4,530)
💸 Stop Losing Money on Trading “Secrets” – See Real Results for $10. Tired of trading courses that promise everything and deliver nothing? You’re not alone. […]
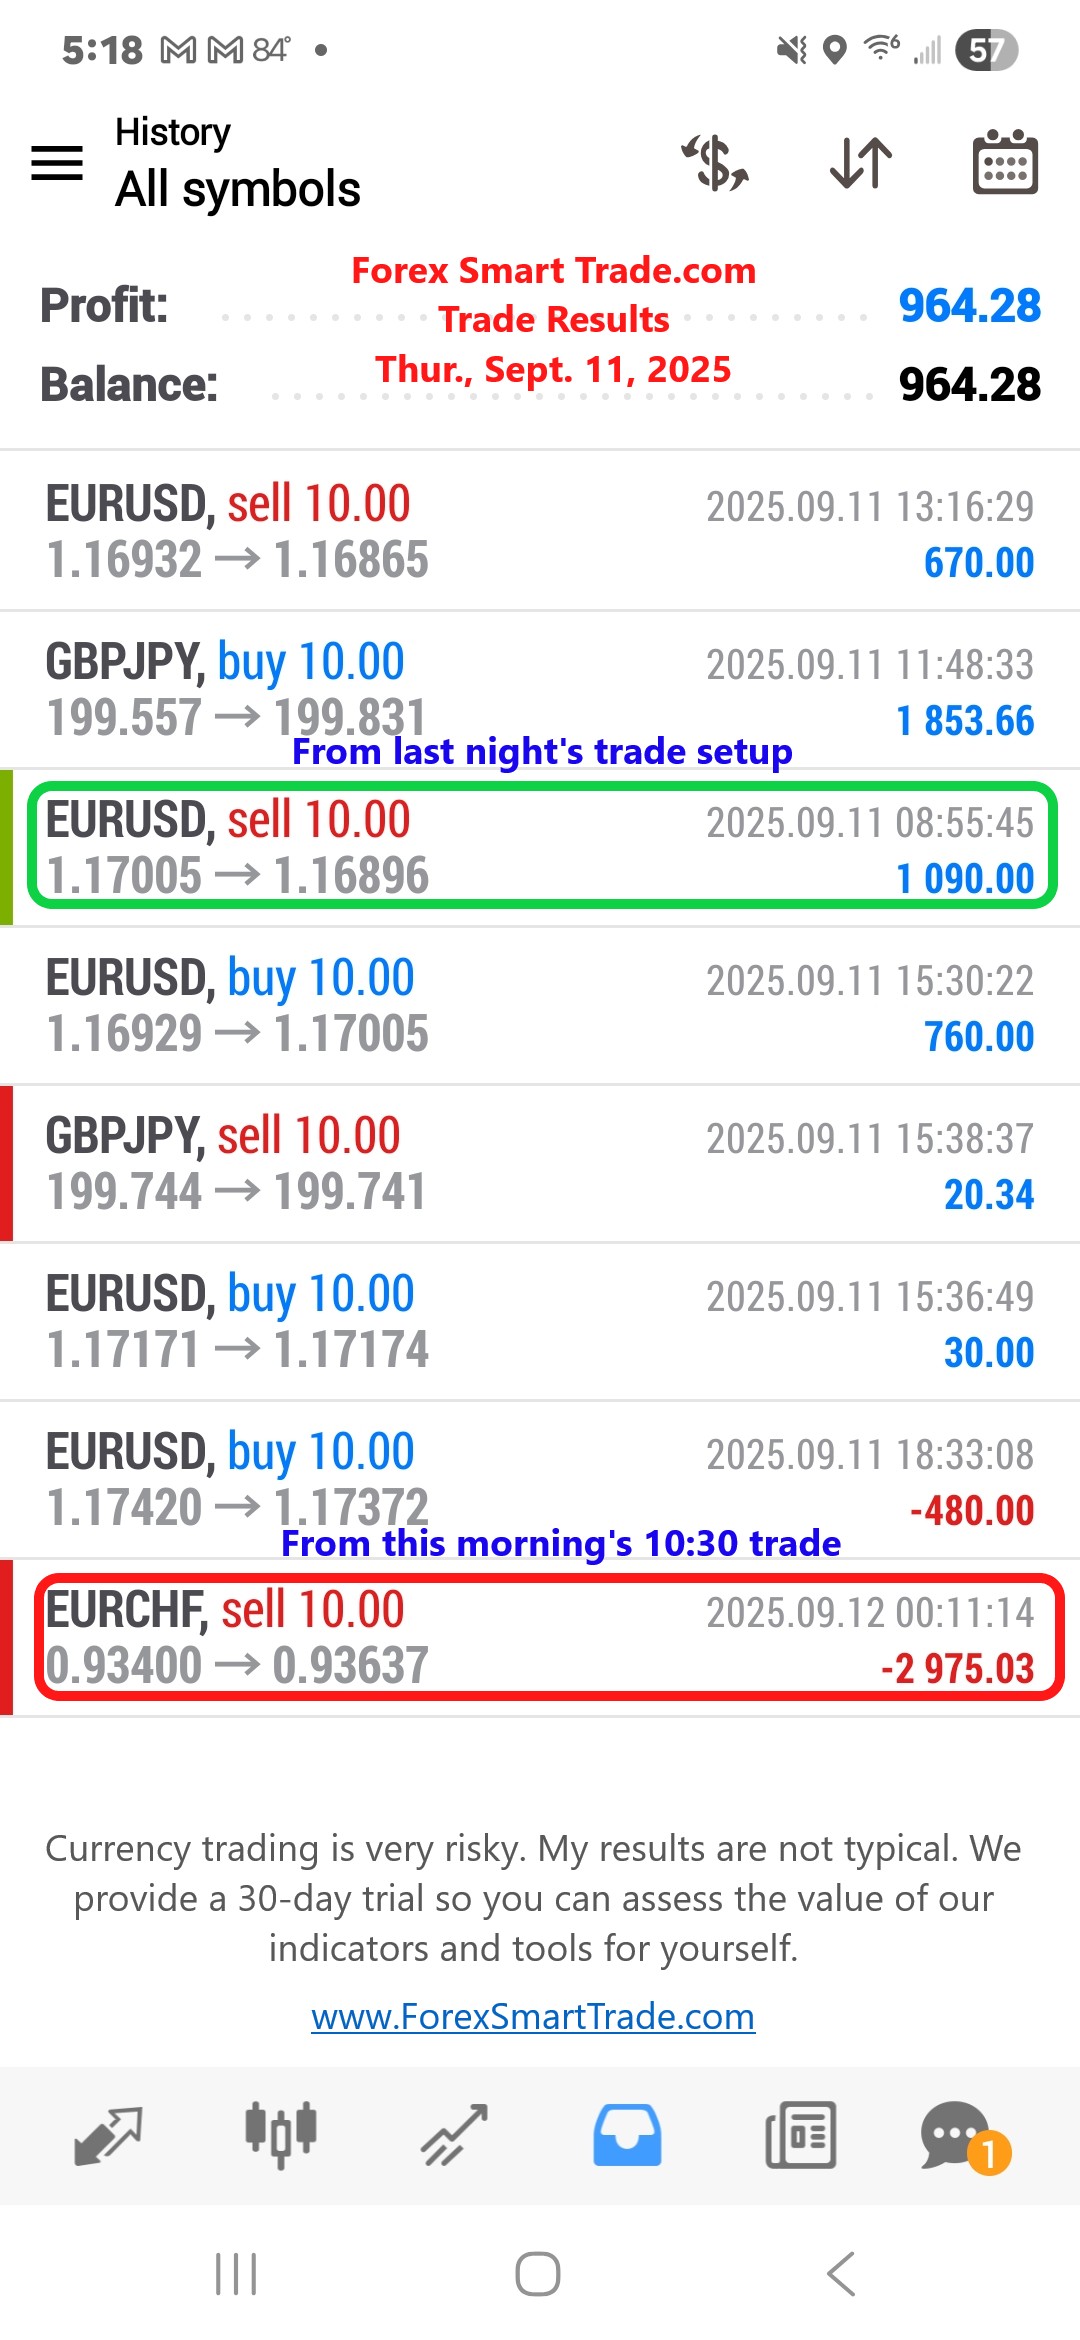
Trade Results. Thur., Sept. 11, 2025: $964
The Promise That Separates Profitable Traders from Everyone Else. It’s a famous story that appears in all the great biographies of Theodore Roosevelt. A young asthmatic […]
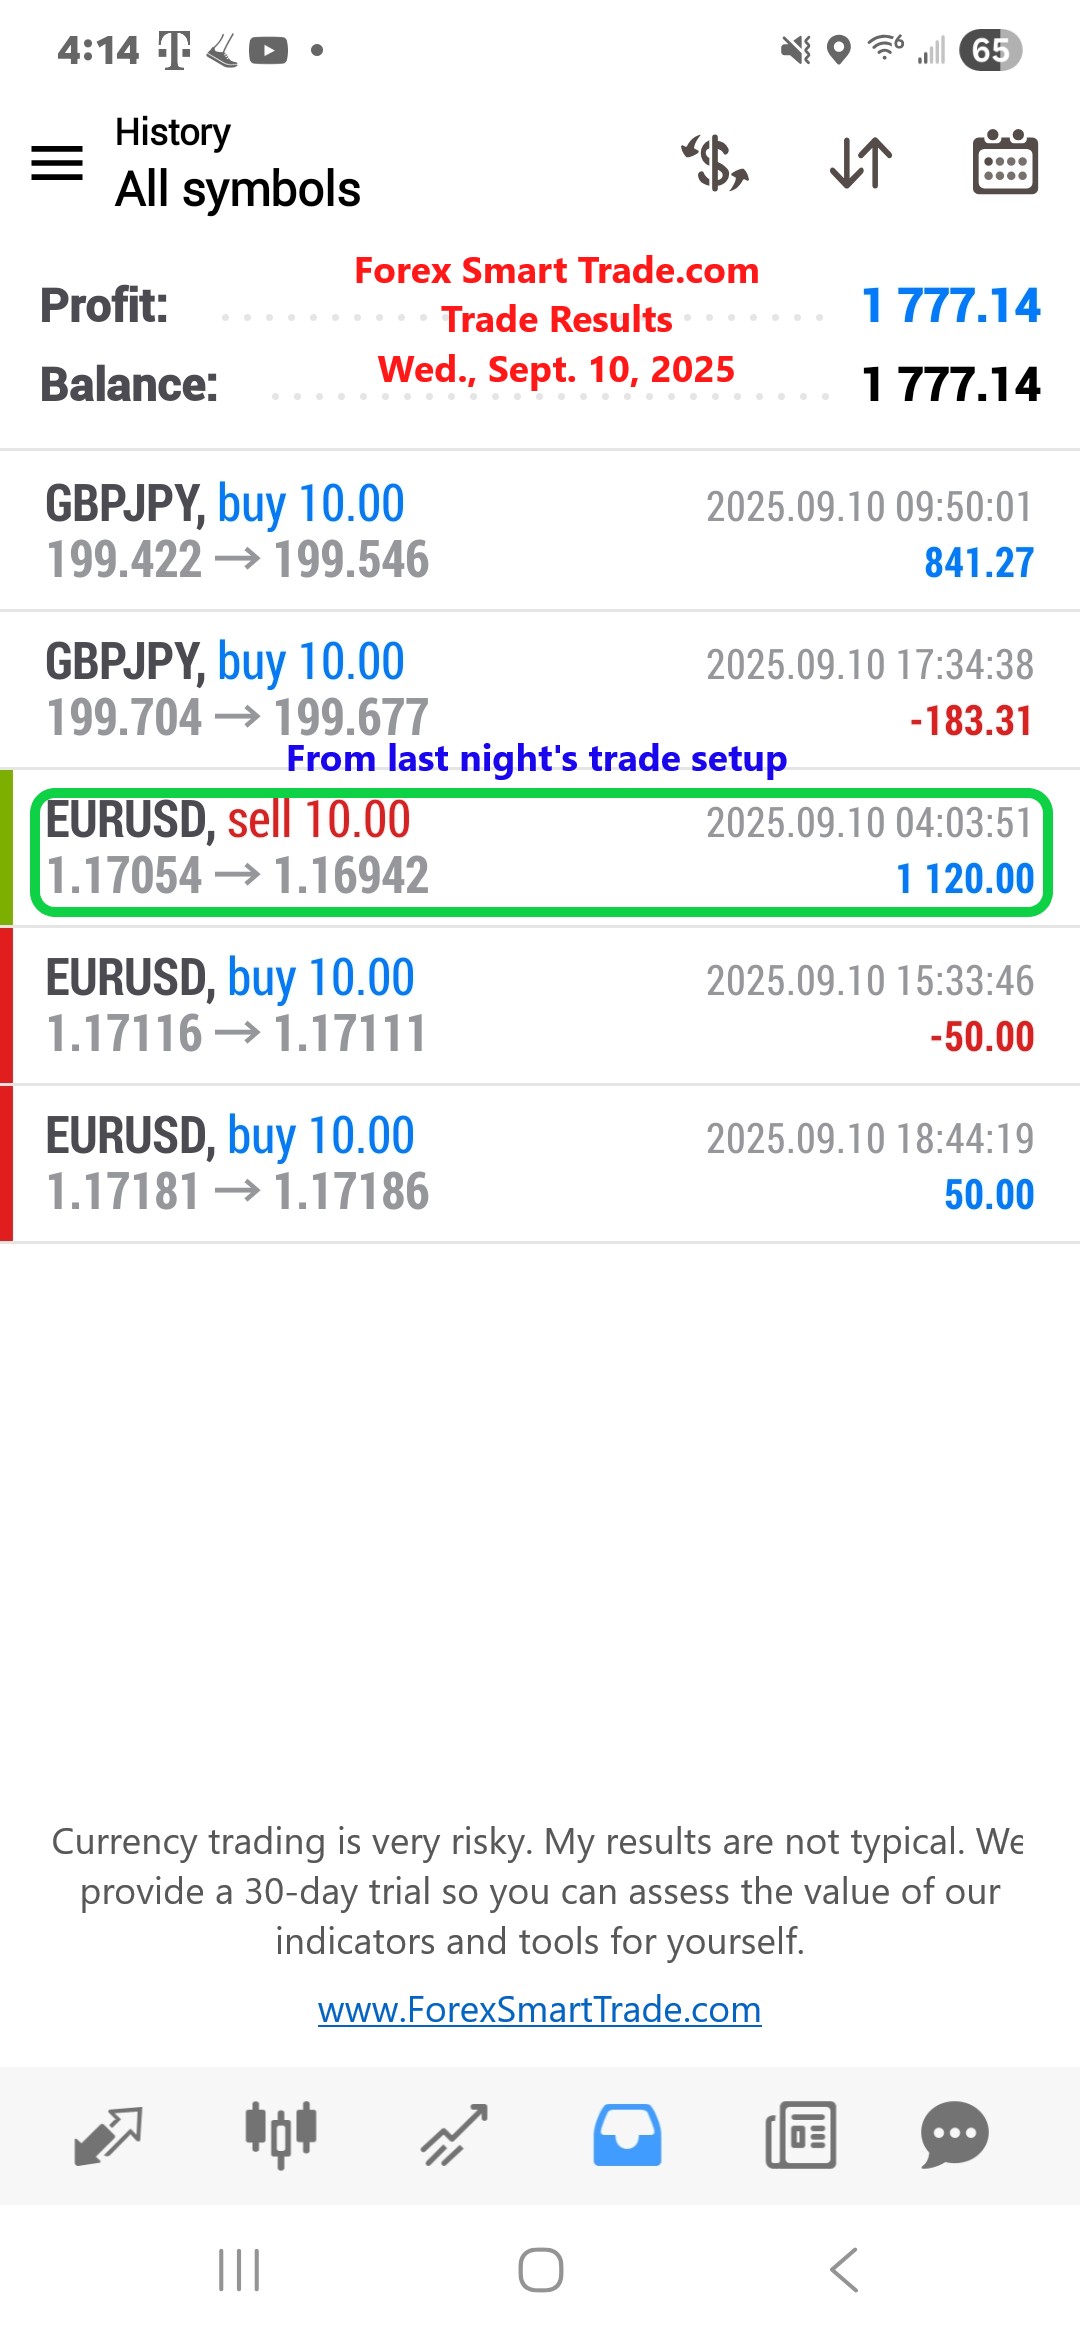
Trade Results. Wed., Sept. 10, 2025: $1,777
The Hidden Connection Between Brain Fog and Trading Losses (And How to Fix Both). Today’s wisdom is from Brain Energy by Chris Palmer—one of my all […]
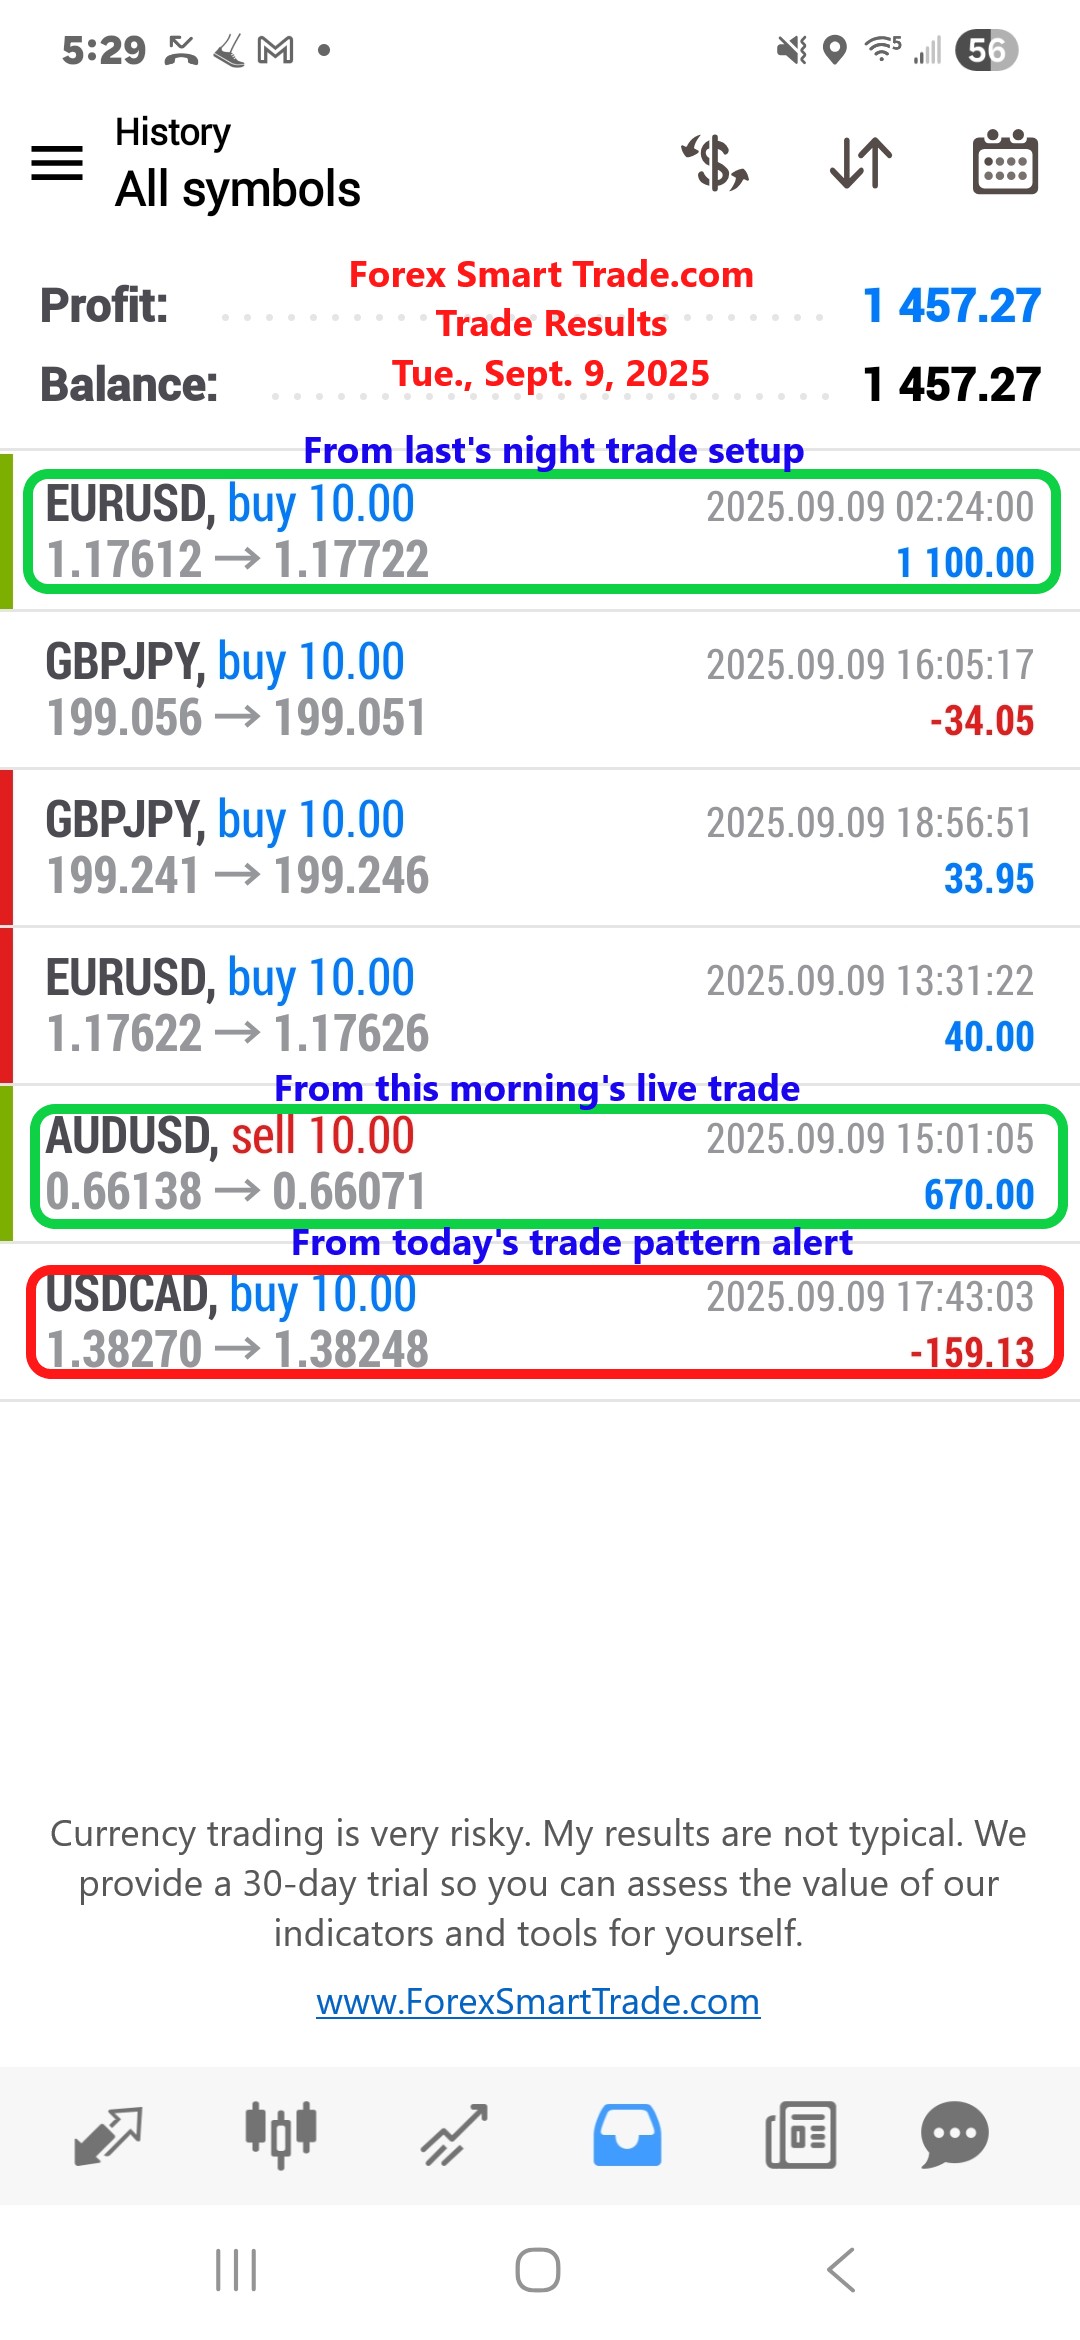
Trade Results. Tue., Sept. 9, 2025: $1,457
The Time Thief That’s Stealing Your Trading Dreams (And How to Stop It Today). Today’s wisdom is from On the Shortness of Life by Seneca. Seneca […]
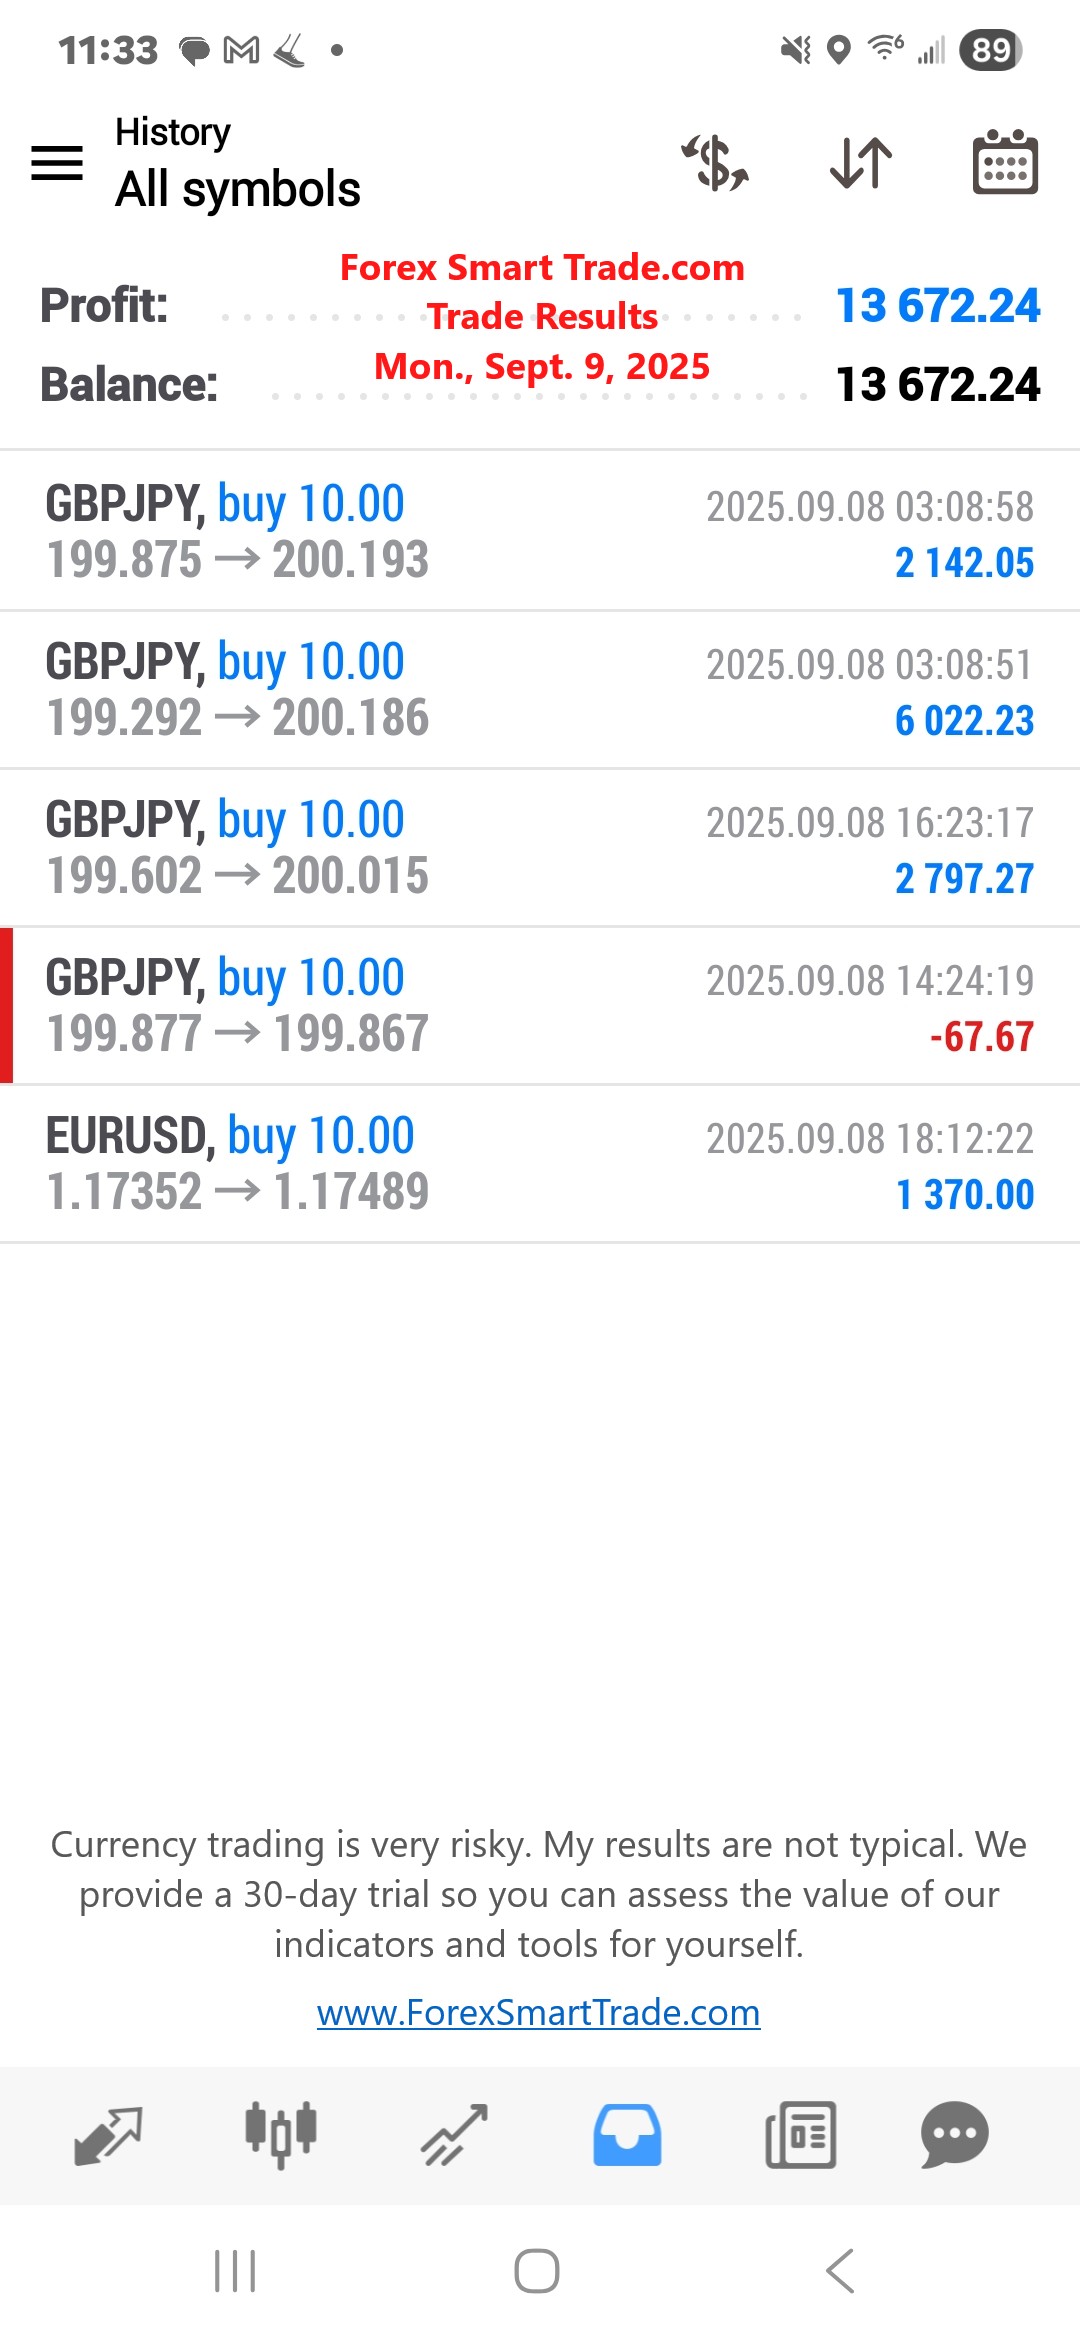
Trade Results. Mon., Sept. 8, 2025: $13,672
The #1 Virtue That Predicts Trading Success (And It’s Not What You Think). Here’s a fascinating fact: Science says zest is the #1 virtue most highly […]
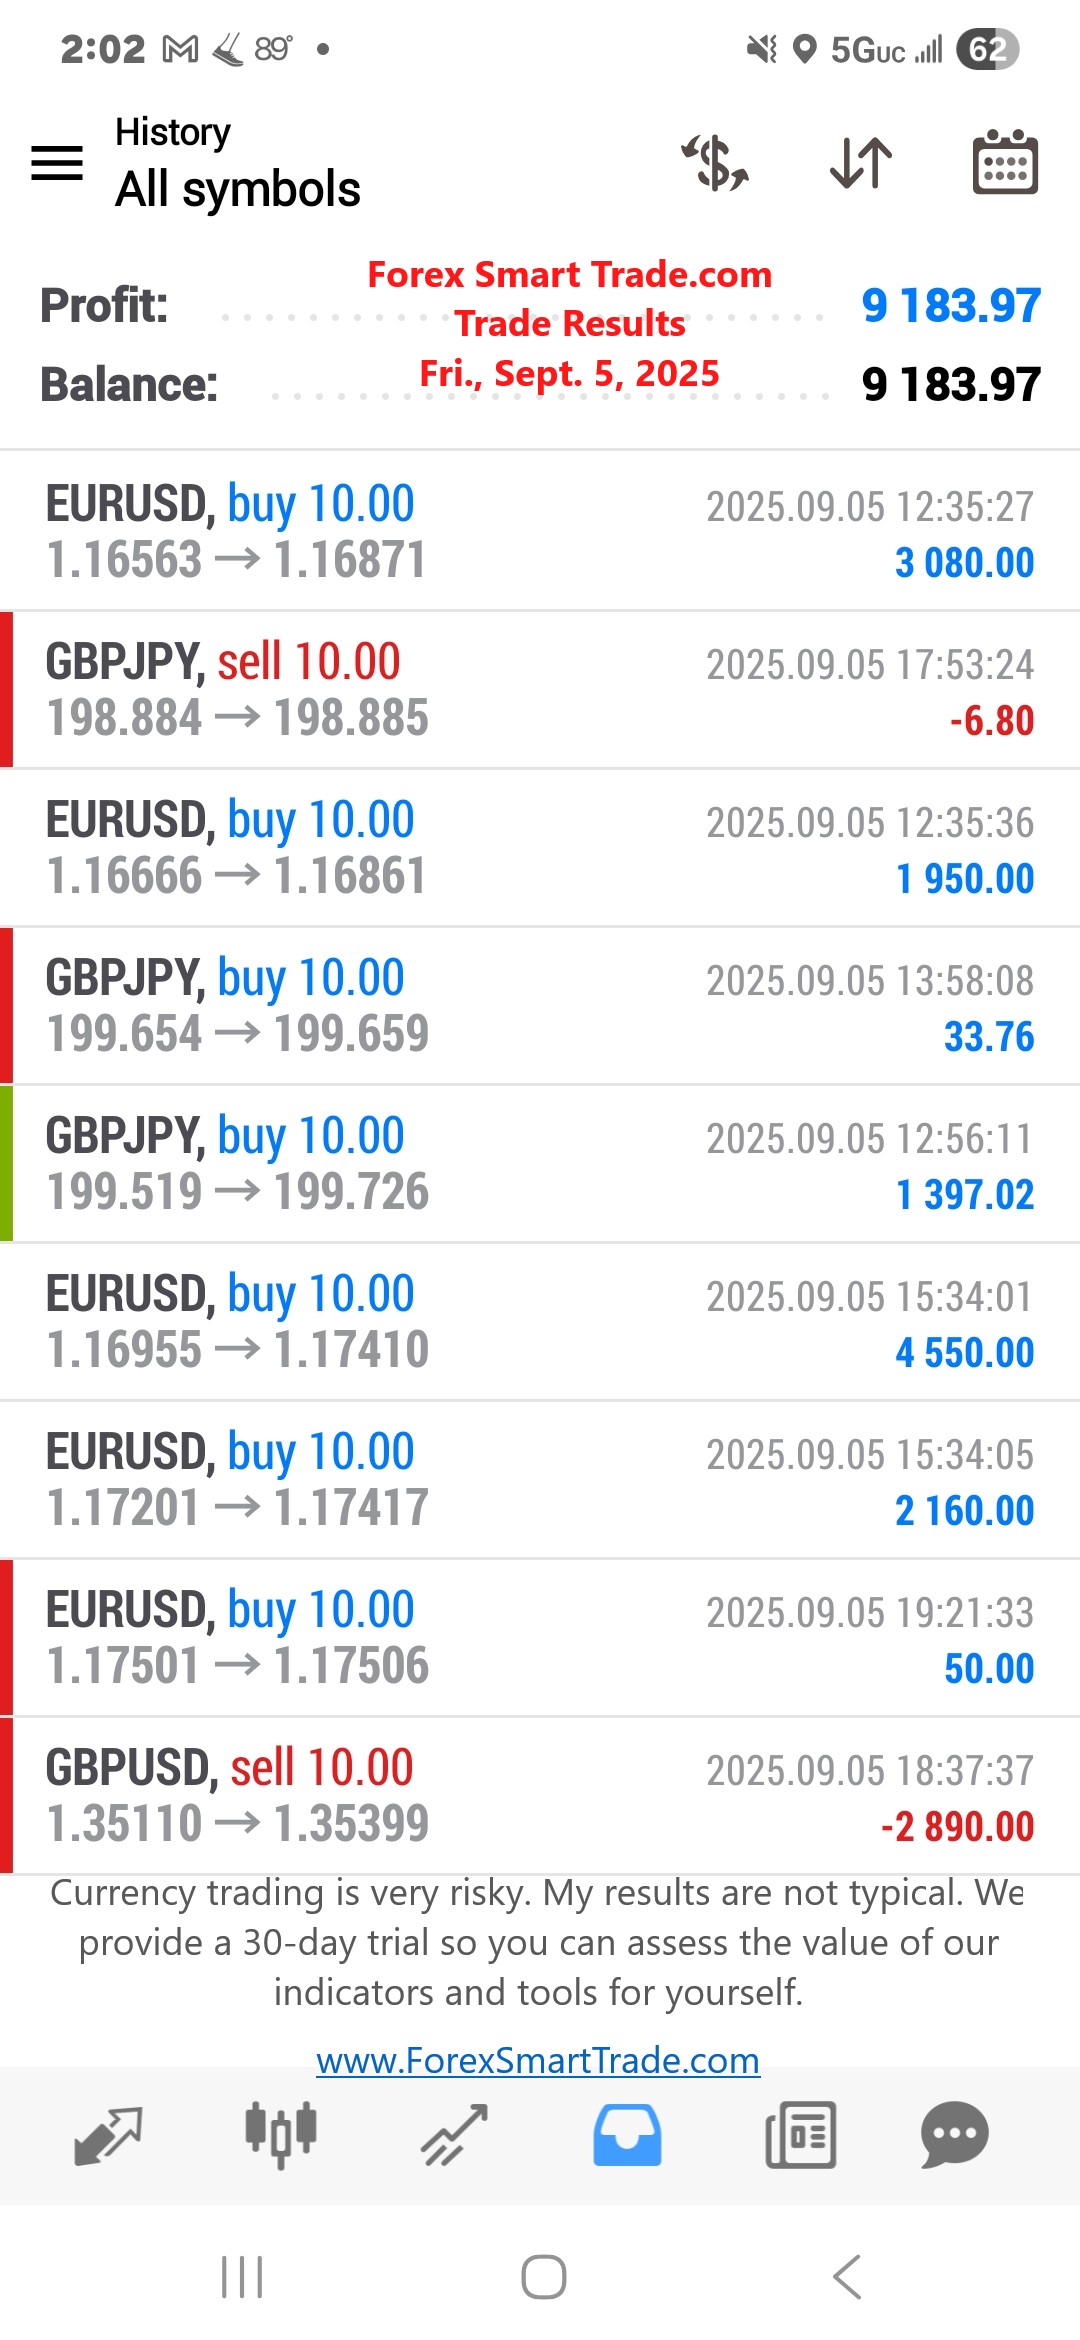
Trade Results. Fri., Sept. 5, 2025: $9,183
💸 Stop Losing Money on Trading “Secrets” – See Real Results for $10 Tired of trading courses that promise everything and deliver nothing? You’re not alone. […]
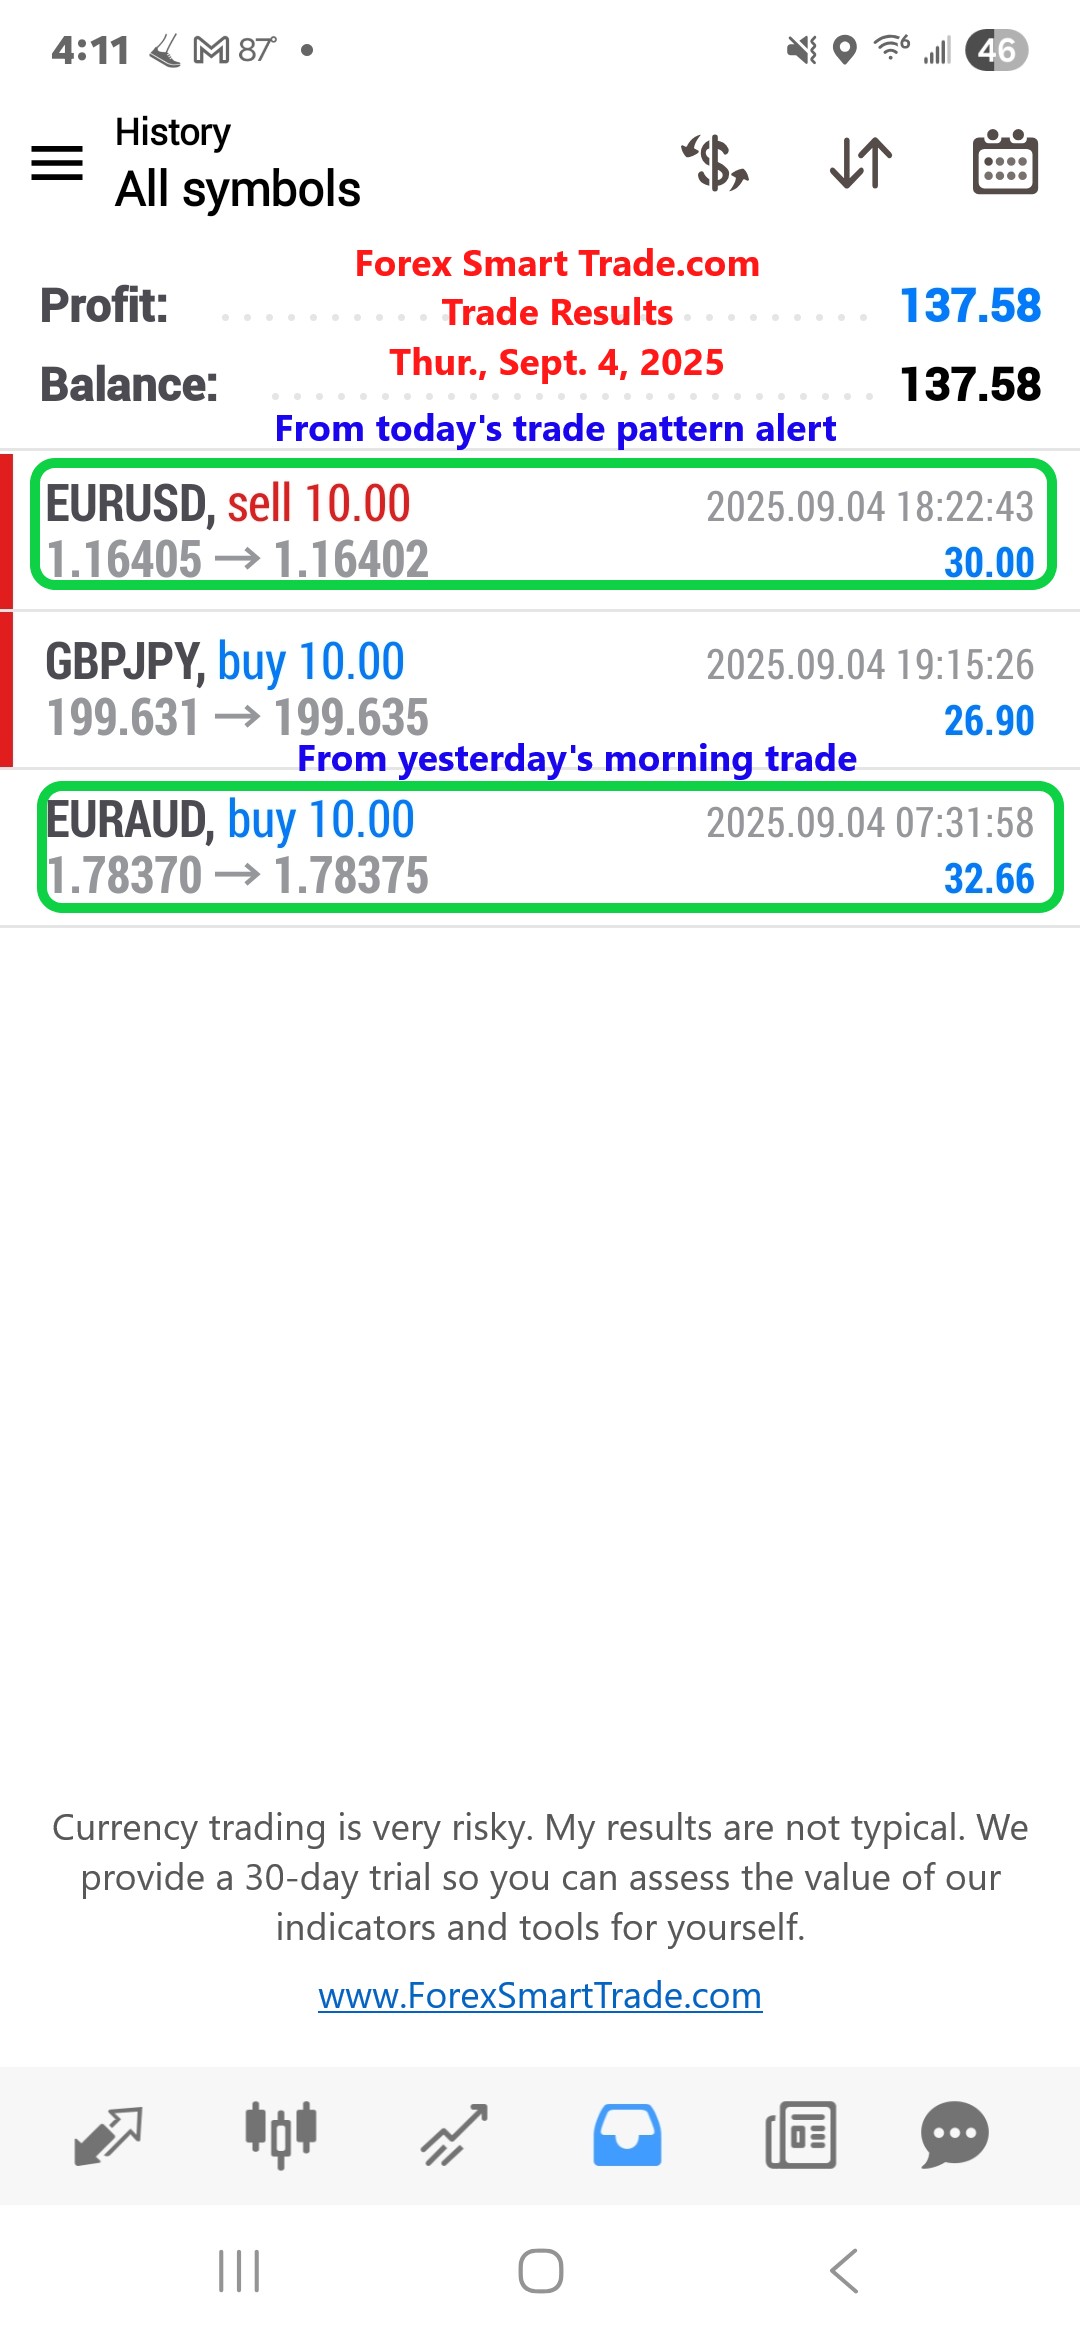
Trade Results. Thur., Sept. 4, 2025: $137
The 20x Trading Goal That Separates Dreamers from Achievers. Mark Divine, retired Navy SEAL and author of Unbeatable Mind, teaches us that we’re all capable of […]