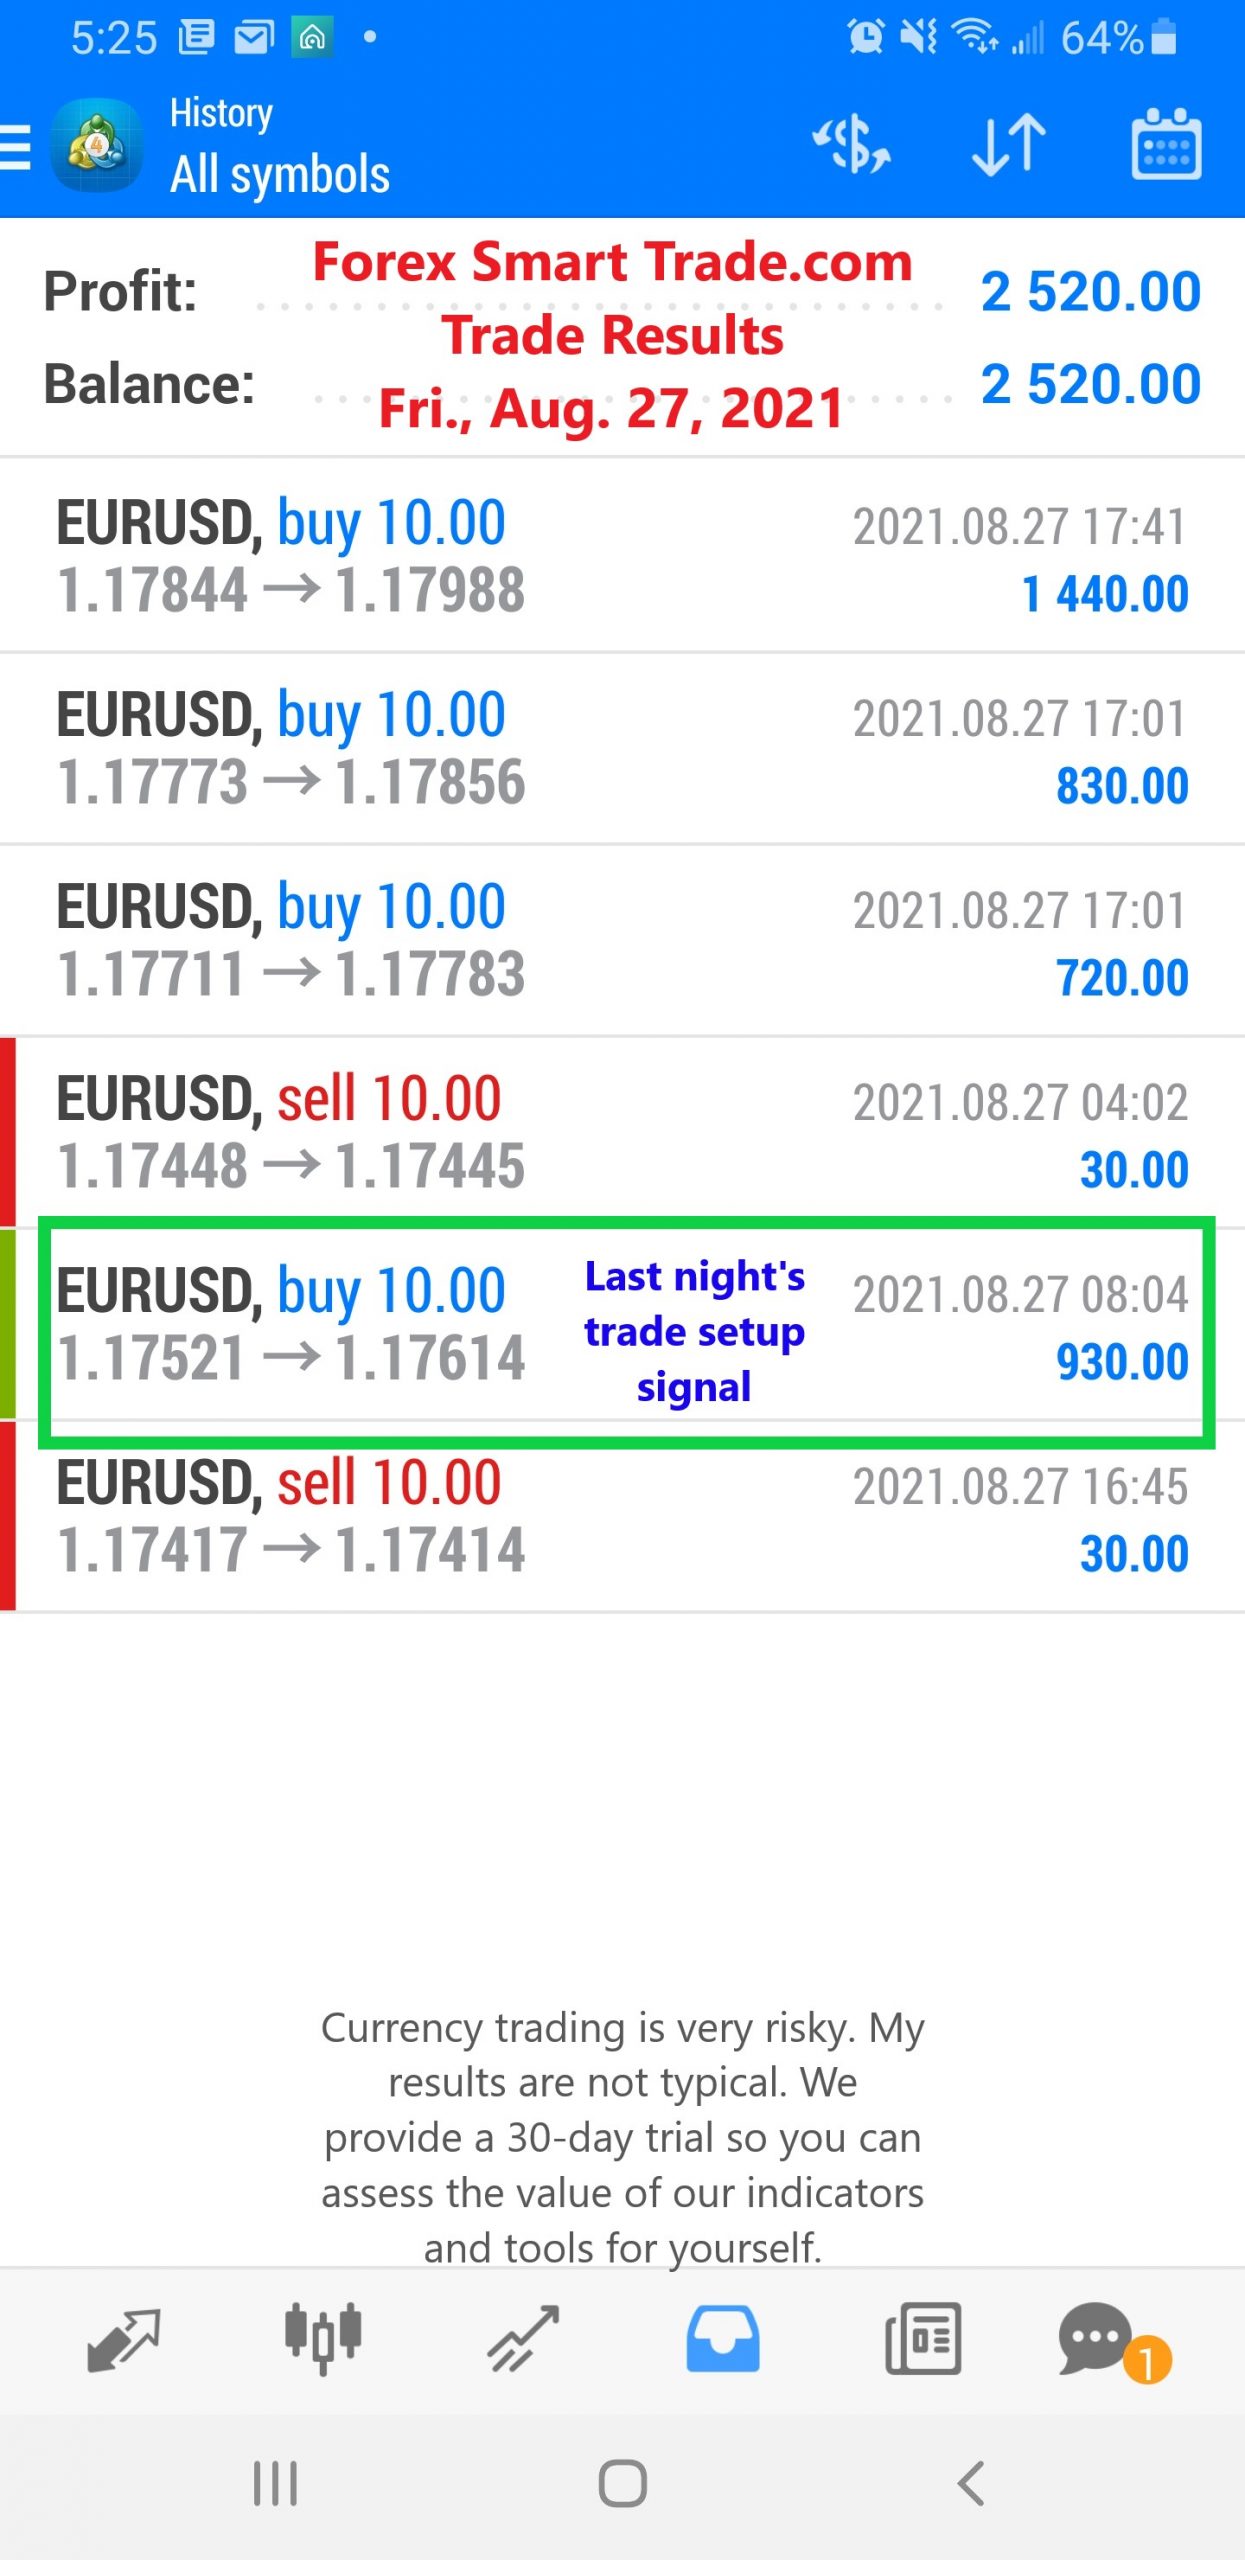
Forex Trade Results August 27, 2021

Forex Trade Results August 26, 2021
August 26, 2021
Forex Trade Results August 30, 2021
August 30, 2021Forex Trade Results August 27, 2021
Learn to Trade Forex – Charts Used in Forex Trading
Different types of charts are used in forex trading to know about currency trends, their closing and opening prices, the market’s direction, and the currency’s movement. Following are the three types of charts used in forex trading. To get additional information to learn to trade forex, visit www.ForexSmartTrade.com
1. Line Charts:
Line charts are the most simple and basic type of charts in forex trading. It tells you the trend for a currency. Line charts represent the closing trading price for a currency during a period specified by the customers.
Lines charts showing trend lines can be used to develop a trading strategy. For example, the trend line can help you look out for breakouts or a change in the currency prices. Although line charts are useful, they are used as a lead for further analysis.
2. Bar Charts:
Bar charts in trading are used to identify the specific periods for trading. They are more forthcoming than line charts. They help traders to identify whether it’s a buyer’s market or a seller’s market.
A single bar chart represents one day of trading. It contains information about the opening price, highest price, lowest price, and closing price (OHLC) for a trade. A dash on the left side represents a day’s opening price, while the dash on the right side represents the day’s closing price.
Sometimes colors are used to indicate the currency movement; for example, the period of rising prices is shown by green or white. On the other hand, red and Black represents the periods of declining prices.
3. Candlestick charts:
In the 18th century, Japanese rice traders were the first to use candlestick charts. As they are visually more appealing, they are easier to decipher than bar and line charts.
But how to read a candlestick chart? The upper portion of a candle indicates the opening and highest price point of a currency, and the lower portion of a candle represents the closing price and lowest price point.
A down candle indicates the declining prices, while the up-candle represents the period of rising prices. The period of declining prices is marked with red colour while the period of increasing prices is indicated by green or white.
The formations and shapes of the candle represent the market direction and currency movement. Some common formations for candlestick charts are hanging man and shooting star.
Learn How To Trade Forex
If you’d like to earn extra income trading on the Forex market, consider learning how to currency trade with Forex Smart Trade. With their super-accurate proprietary trading tools and best-in-the-business, personalized one-on-one training, you’ll be successful. Check out the Forex Smart Trade webinar that shows one of their trader’s trading and how easy, intuitive, and accurate the tools are. Or try the Forex Smart Trade 30-day introductory trial for just ONE dollar.