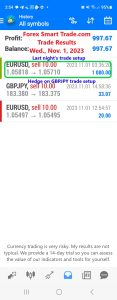
Forex Smart Trade Results, Wednesday, November 1, 2023 – $997

Forex Smart Trade Results, Tuesday, October 31, 2023 – $10,452
November 5, 2023
Forex Smart Trade Results, Thursday, November 2, 2023 – $5,689
November 5, 2023How to Trade a Hidden Divergence.
Next, let’s take a look at an example of some hidden divergence.
Once again, let’s hop on to the daily chart of USD/CHF.
Here we see that the pair has been in a downtrend.
Notice how the price has formed a lower high, but the stochastic is printing higher highs.
According to our notes, this is a hidden bearish divergence!
Hmmm, what should we do? Time to get back on the trend?
Well, if you ain’t sure, you can sit back and watch on the sidelines first.
If you decided to sit that one out, you might be as bald as Professor Xavier now because you pulled out all your hair.
Why?
Well, the trend continued!
Price bounced from the trend line and eventually dropped almost 2,000 pips!
Imagine if you had spotted the divergence and seen that as a potential signal for a continuation of the trend.
Not only would you be sipping those margaritas in the Caribbean, but you’d also have your pimping yacht to boot!

Learn to Trade
If you’d like to earn extra income trading on the Forex market, consider learning how to currency trade with Forex Smart Trade. With their super-accurate proprietary trading tools and best-in-the-business, personalized one-on-one training, you’ll be successful. Check out the Forex Smart Trade webinar. It shows one of their trader’s trading and how easy, intuitive, and accurate the tools are. Or try the Forex Smart Trade 14-day introductory trial for just TEN dollars.


