Forex Smart Trade Results, Wednesday, April 27, 2023 – $2,935

Forex Smart Trade Results, Tuesday, April 25, 2023 – $8,558
May 2, 2023
Forex Smart Trade Results, Thursday, April 27, 2023 – $5,526
May 16, 2023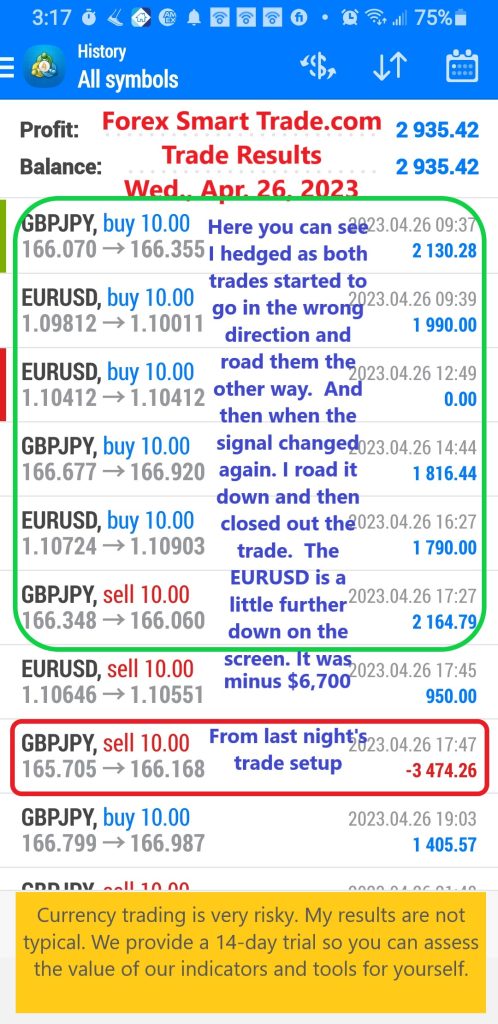
Moving Averages as Dynamic Support and Resistance Levels.
Continuing our discussion of moving averages as dynamic support and resistance levels.
Let’s take another look at that 15-minute chart of GBP/USD, but this time let’s use the 10 and 20 EMAs.

From the chart above, you see that price went slightly past the 10 EMA a few pips but proceeded to drop afterward.
There are some traders who use intraday strategies just like this.
The idea is that just like your horizontal support and resistance areas, these moving averages should be treated like zones or areas of interest.
The area between moving averages could be considered as a zone of support or resistance.
Breaking through Dynamic Support and Resistance
Now you know that moving averages can potentially act as support and resistance. Combining a couple of them, you can have yourself a nice little zone.
But you should also know that they can break, just like any support and resistance level!
Let’s take another look at the 50 EMA on GBP/USD’s 15-min chart.

In the chart above, we see that the 50 EMA held as a strong resistance level for a while as GBP/USD repeatedly bounced off it.
However, as we’ve highlighted with the red box, the price finally broke through and shot up.
Price then retraced and tested the 50 EMA again, which proved to be a strong support level.
So there you have it, folks!
Moving averages can also act as dynamic support and resistance levels.
One nice thing about using moving averages is that they’re always changing, which means that you can just leave it on your chart and don’t have to keep looking back in time to spot potential support and resistance levels.
You know that the line most likely represents a moving area of interest. The only problem, of course, is figuring out which moving average to use!

Learn to Day Trade Forex
If you’d like to earn extra income trading on the Forex market, consider learning how to currency trade with Forex Smart Trade. With their super-accurate proprietary trading tools and best-in-the-business, personalized one-on-one training, you’ll be successful. Check out the Forex Smart Trade webinar. It shows one of their trader’s trading and how easy, intuitive, and accurate the tools are. Or try the Forex Smart Trade 14-day introductory trial for just TEN dollars.