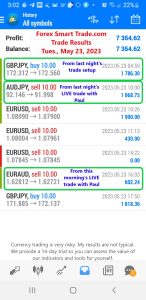
Forex Smart Trade Results, Tuesday, May 23, 2023 – $7,354

Forex Smart Trade Results, Monday, May 22, 2023 – $7,623
June 4, 2023
Forex Smart Trade Results, Wednesday, May 24, 2023 – $5,045
June 4, 2023What are Bollinger Bands?
Let’s take a look at what are Bollinger Bands.
We typically plotted Bollinger Bands as three lines:
- An upper band
- A middle line
- A lower band
The middle line of the indicator is a simple moving average (SMA).
Most charting programs default to a 20-period.
This is fine for most traders, but you can experiment with different moving average lengths after you get a little experience applying Bollinger Bands.
The upper and lower bands, by default, represent two standard deviations above and below the middle line (moving average).
If you’re freaking out because you’re not familiar with standard deviations.
Have no fear.
Standard Deviations
The concept of standard deviation (SD) is just a measure of how spread out numbers are.
If the upper and lower bands are 1 standard deviation.
So about 68% of price moves that have occurred recently are CONTAINED within these bands.
If the upper and lower bands are 2 standard deviations.
So here about 95% of price moves that have occurred recently are CONTAINED within these bands.
You’re probably falling asleep let’s hit you with an image.
As you can see, the higher the value of SD you use for the bands, the more prices the bands “capture”.
Once you become more familiar with them, you can try out different standard deviations for the bands.
To get started, however, you don’t need to know most of this stuff.
We think it’s more important that we show you some ways you can apply the Bollinger Bands to your trading.
Note: If you really want to learn about the calculations of Bollinger Bands, check out John’s book, Bollinger on Bollinger Bands.

Learn to Day Trade Forex
If you’d like to earn extra income trading on the Forex market, consider learning how to currency trade with Forex Smart Trade. With their super-accurate proprietary trading tools and best-in-the-business, personalized one-on-one training, you’ll be successful. Check out the Forex Smart Trade webinar. It shows one of their trader’s trading and how easy, intuitive, and accurate the tools are. Or try the Forex Smart Trade 14-day introductory trial for just TEN ($10) dollars.


