Forex Smart Trade Results, Tuesday, December 19, 2023 – $7,184

Forex Smart Trade Results, Monday, December 18, 2023 – $2,872
December 26, 2023
Forex Smart Trade Results, Wednesday, December 20, 2023 – $2,050
December 26, 2023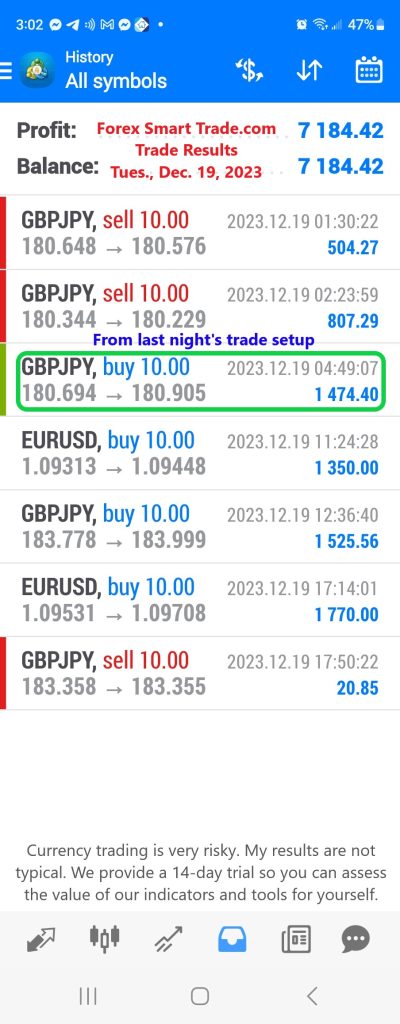
Chart Patterns.
Chart patterns are physical groupings of the price you can actually see with your own eyes.
They are an important part of technical analysis and also help you in your decision-making process.
Two common patterns where false breakouts tend to occur are:
- Head and Shoulders
- Double Top/Bottom
Head and Shoulders
The head and shoulders chart pattern is actually one of the hardest patterns for new traders to spot.
However, with time and experience, this pattern can become an instrumental part of your trading arsenal.
The head and shoulders pattern is considered a reversal.
If formed at the end of an uptrend, it could signal a bearish reversal.
Conversely, if it is formed at the end of a downtrend, it could signal a bullish reversal.
Head and shoulders are known for generating fakeouts (false breakouts) and creating perfect opportunities for fading breakouts.
False breakouts are common with this pattern because many traders who have noticed this formation usually put their stop loss very near the neckline.

When the pattern experiences a false breakout, prices will usually rebound.
Traders who have sold the downside breakout or who have bought the upside breakout will have their stops triggered when prices move against their positions.
The institutional traders who want to scrape money from the hands of individual traders usually cause this.

In a head and shoulders pattern, you can assume that the first break tends to be false.
You can fade the breakout with a limit order back in the neckline and just put your stop above the high of the fakeout candle.
You could place your target a little below the high of the second shoulder or a little above the low of the second shoulder of the inverse pattern.
Double Top / Double Botton
The next pattern is the double top or the double bottom.
Traders just love these patterns! Why do you ask? Well, it is because they’re the easiest to spot!
When the price breaks below the neckline, it signals a possible trend reversal.
Because of this, plenty of traders place their entry orders very near the neckline in case of a reversal.

The problem with these chart patterns is that countless traders know them and place orders at similar positions.
This leaves the institutional traders open to scrape money from the commoner’s hands.

Similar to the head and shoulders pattern, you can place your order once the price goes back in to catch the bounce. You can set your stops just beyond the fakeout candle.
What kind of market should I fade breakouts?
The best results tend to occur in a range-bound market.
However, you cannot ignore market sentiment, major news events, common sense, and other types of market analysis.
Financial markets spend a lot of time bouncing back and forth between a range of prices and do not deviate much from these highs and lows.
Ranges are bound by a support level and a resistance level, and buyers and sellers continually push prices up and down within those levels.
Fading the breakouts in these range-bound environments can prove to be very profitable.
However, at some point, one side is eventually going to take over and a new trending stage will form.

Learn to Trade Forex
If you’d like to earn extra income trading on the Forex market, consider learning how to currency trade with Forex Smart Trade. With their super-accurate proprietary trading tools and best-in-the-business, personalized one-on-one training, you’ll be successful. Check out the Forex Smart Trade webinar. It shows one of their trader’s trading and how easy, intuitive, and accurate the tools are. Or try the Forex Smart Trade 14-day introductory trial for just TEN dollars.
Currency trading is very risky. My results are not typical. We provide a 14-day trial so you can assess the value of our indicators and tools for yourself.