Forex Smart Trade Results, Friday, September 22, 2023 – $7,649

Forex Smart Trade Results, Thursday, September 21, 2023 – $3,358
October 1, 2023
Forex Smart Trade Results, Monday, September 25, 2025 – ($126)
October 1, 2023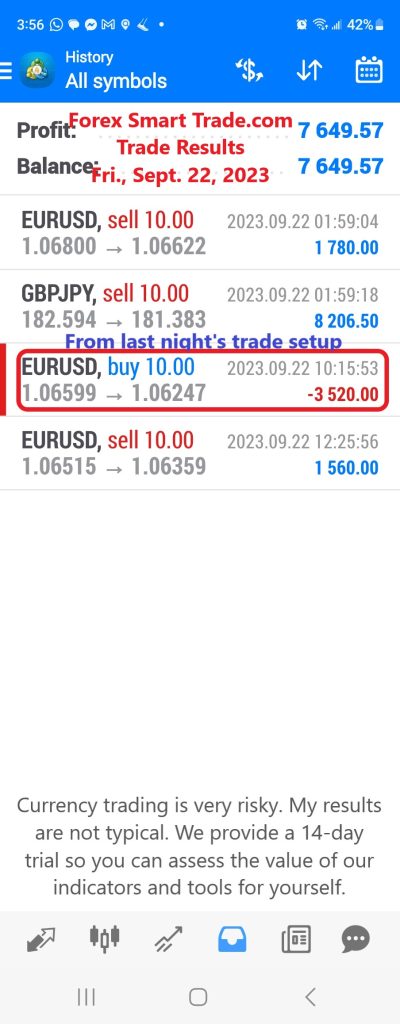
The Limitations of Heikin Ashi.
Let’s continue our discussion from yesterday on the limitations of Heikin Ashi.
Now let’s look at a daily chart of EUR/USD using a traditional Japanese candlestick chart:

Focus on the last candlestick. A couple of things to notice:
- The candle is green. Which means the candle closed higher than it opened.
- This is REALITY. The EUR/USD pair actually ended up for the day. Compare this to Heikin Ashi, where it showed a red candle.
- Its open price was 1.08373.
- Its close price was 1.08706.
Let’s review what we just observed:
| Chart Type | Last Candlestick | Open Price | Close Price |
| Heikin Ashi Candlestick | Red | 1.09005 | 1.08531 |
| Traditional Candlestick | Green | 1.08373 | 1.08706 |
Do you see the difference?
Even though the “real” candle closed green, Heikin Ashi is signaling that EUR/USD is still in a downtrend.
Make sure you know what price you’re looking at.
Since you can’t see the actual open and close prices, some traders prefer to use a Heikin Ashi chart as more of an INDICATOR rather than a price chart itself.
Heikin Ashi charts obscure actual price information.
This limitation is related to the first one.
The closing price is considered important for many traders, but the actual closing price is NOT displayed on a Heikin Ashi candlestick.
As a review, here’s how the Close price is calculated:
Close = (Open+High+Low+Close) / 4
You only see the averaged closing price.
Make sure you’re aware of the actual closing price, and not just the averaged value.
This can be done easily by switching back to a regular Japanese candlestick chart.
Heikin Ashi charts may not be responsive enough for day traders or scalpers.
Since Heikin Ashi candlestick requires price information from two periods, a trade setup takes longer to develop.
This isn’t really an issue for longer-term traders, like swing traders or position traders, who have more time to let their trades develop.
But it might be an issue for shorter-term traders like day traders and scalpers.
For example, scalpers need to exploit quick price moves so they may find that Heikin Ashi charts are not responsive enough for their type of trading.

Learn How To Successfully Trade Forex
If you’d like to earn extra income trading on the Forex market, consider learning how to currency trade with Forex Smart Trade. With their super-accurate proprietary trading tools and best-in-the-business, personalized one-on-one training, you’ll be successful. Check out the Forex Smart Trade webinar. It shows one of their trader’s trading and how easy, intuitive, and accurate the tools are. Or try the Forex Smart Trade 14-day introductory trial for just TEN dollars.