Forex Smart Trade Results, Friday, March 15, 2024 – $2,940

Forex Smart Trade Results, Thursday, March 14, 2024 – $4,915
March 16, 2024
Forex Smart Trade Results, Monday, March 18, 2024 – $3,355
March 30, 2024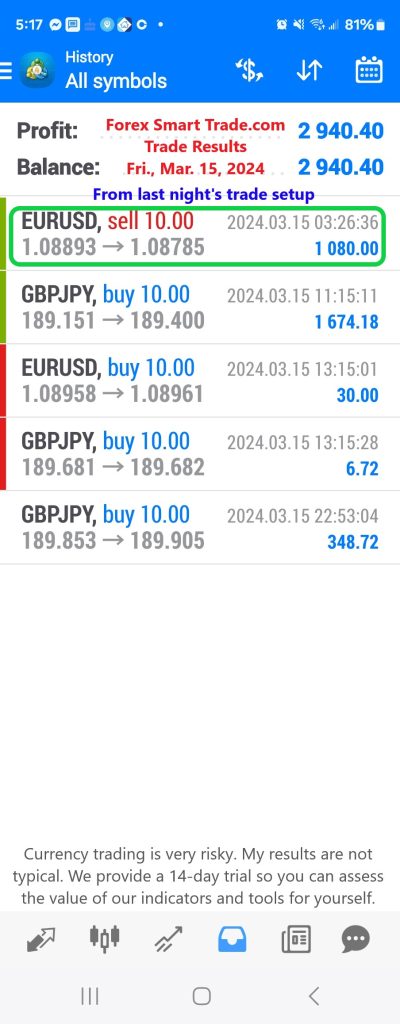
How to Perform Multiple Time Frame Analysis.
Let’s say that Cinderella, who gets bored all day cleaning up after her evil stepsisters, decides that she wants to trade forex.
After some demo trading, she realizes that she likes trading the EUR/USD pair the most, and feels most comfortable looking at the 1-hour chart.
She thinks that the 15-minute charts are too fast while the 4-hour take too long – after all, she needs her beauty sleep.
Find the Trend
The first thing that Cinderella does is move up to check out the 4-hour chart of EUR/USD.
This will help her determine the overall trend.

She sees that the pair is clearly in an uptrend.
This signals to Cinderella that she should ONLY be looking for BUY signals.
After all, the trend is her friend, right? She doesn’t want to get caught in the wrong direction and lose her slipper.
Zoom Back
Now, she zooms back to her preferred time frame, the 1-hour chart, to help her spot an entry point.
She also decides to pop on the Stochastic indicator.

Once she goes back down to the 1-hour chart, Cinderella sees that a doji candlestick has formed and the Stochastic has just crossed over out of oversold conditions!
But Cinderella still isn’t quite sure…. she wants to make sure she has a really good entry point, so she scales down to the 15-minute chart to help her find an even better entry and to give her more confirmation.

So now Cinderella is locking her eyes in on the 15-minute chart, and she sees that the trend line seems to be holding pretty strongly.
Not only that, but Stochastic is showing oversold conditions in the 15-minute time frame as well!
She figures that this could be a good time to enter and buy.
Let’s see what happens next.

As it turns out, the uptrend continues, and EUR/USD continues to rise up the charts.
Cinderella would have entered just above 1.2800 and if she had kept the trade open for a couple of weeks, she would have made 400 pips!
She could have bought another pair of glass slippers!
Limits on the Number of Time Frames
There is a limit to how many time frames you can study. You don’t want a screen full of charts telling you different things.
Use at least TWO, but not more than THREE time frames.
Adding more will just confuse you and you’ll suffer from analysis paralysis, then proceed to go crazy.
Is there a wrong way to do multiple time frame analysis, you ask?
At the end of the day, it really is all about finding what works best for you.
Learn How To Successfully Trade Forex
If you’d like to earn extra income trading on the Forex market, consider learning how to currency trade with Forex Smart Trade. With their super-accurate proprietary trading tools and best-in-the-business, personalized one-on-one training, you’ll be successful. Check out the Forex Smart Trade webinar. It shows one of their trader’s trading and how easy, intuitive, and accurate the tools are. Or try the Forex Smart Trade 14-day introductory trial for just TEN dollars.
Currency trading is very risky. My results are not typical. We provide a 14-day trial so you can assess the value of our indicators and tools for yourself.