Let’s look at how to use rectangle chart patterns to trade breakouts.
What is a rectangle chart pattern?
A rectangle is a chart pattern formed when the price is bounded by parallel support and resistance levels.
A rectangle exhibits a period of consolidation or indecision between buyers and sellers as they take turns throwing punches but neither has dominated.
Testing support and resistance
The price will “test” the support and resistance levels several times before eventually breaking out.
From there, the price could trend in the direction of the breakout, whether it is to the upside or downside.

In the example above, we can clearly see that the pair was bounded by two key price levels which are parallel to one another.
We just have to wait until one of these levels breaks and go along for the ride!
Remember, when you spot a rectangle: THINK OUTSIDE THE BOX!

Learn How To Successfully Trade Forex
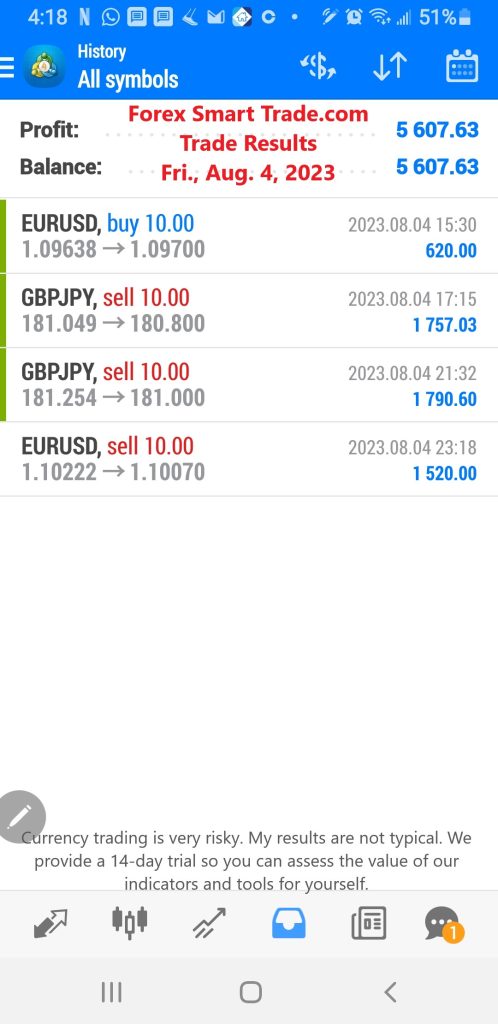
If you’d like to earn extra income trading on the Forex market, consider learning how to currency trade with Forex Smart Trade. With their super-accurate proprietary trading tools and best-in-the-business, personalized one-on-one training, you’ll be successful. Check out the Forex Smart Trade webinar. It shows one of their trader’s trading and how easy, intuitive, and accurate the tools are. Or try the Forex Smart Trade 14-day introductory trial for just TEN dollars.