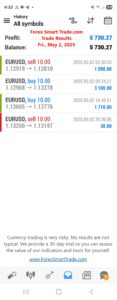
While your bottom line (total profit or loss) can easily tell you your overall trading performance, keeping statistics is a great way to find out what parts of your trading system are keeping you from running like a finely tuned race car instead of a junkyard clunker.
Your “performance stats” help you determine what’s working, what’s not working, and what to improve on.
Here are some of the statistics to keep, at a minimum, to track your system vitals.
Net Profit
Your net profit is your total gain minus losses and expenses. These expenses include the cost of equipment, commissions, and other costs. Basically, this is how much your account is up or down at any given time minus costs to trade.
Win %
Win percentage is the total number of wins divided by the total number of trades. What percent of the time do you win trades?
Loss %
Loss percentage is the total number of losses divided by the total number of trades. What percent of the time do you lose trades?
Largest Winning Trade
Your largest winning trade will be removed from your “average win” calculation.
This is not necessary to do, but if you do have an abnormally large win in relation to your other wins, then taking it out will provide a more accurate look and expectations to your stats.
Largest Losing Trade
Your largest losing trade will be removed from your “average loss” calculation.
This is not necessary to do, but if you do have an abnormally large loss in relation to your other losses, then taking it out will provide a more accurate look and expectations to your stats.
Average Winning Trade
The average gain per winning trade is computed by dividing the total gain from all your winning trades divided by the number of winning trades.
Average Losing Trade
The average loss per losing trade is your total loss from all your losing trades divided by the total number of losing trades.
Payoff Ratio per Trade
The payoff ratio per trade is your average winning trade minus your average losing trade.
Average Holding Time per Trade
The average holding time per trade is calculated by dividing your total holding time for all your trades by the number of trades.
P/L of Long Trades vs P/L of Short Trades
This stat helps determine what types of trades or trading environments you perform well in.
Largest # of Consecutive Losses
This stat helps in determining your max drawdown, or the worse possible scenario you have experienced so far.
Average # of Consecutive Losses
This stat helps in determining your average drawdown and controlling your potential max risk.
Maximum Drawdown
The maximum drawdown is the worst period of “peak to valley’” performance of your trading system.
Trading Expectancy
In simple terms, expectancy is the average amount you can expect to win (or lose) per trade.
This can be computed by multiplying the loss percentage by the average loss and subtracting it from the win percentage times the average win. This stat helps you determine the correct position size and how profitable your trading method is.


