Trade Results
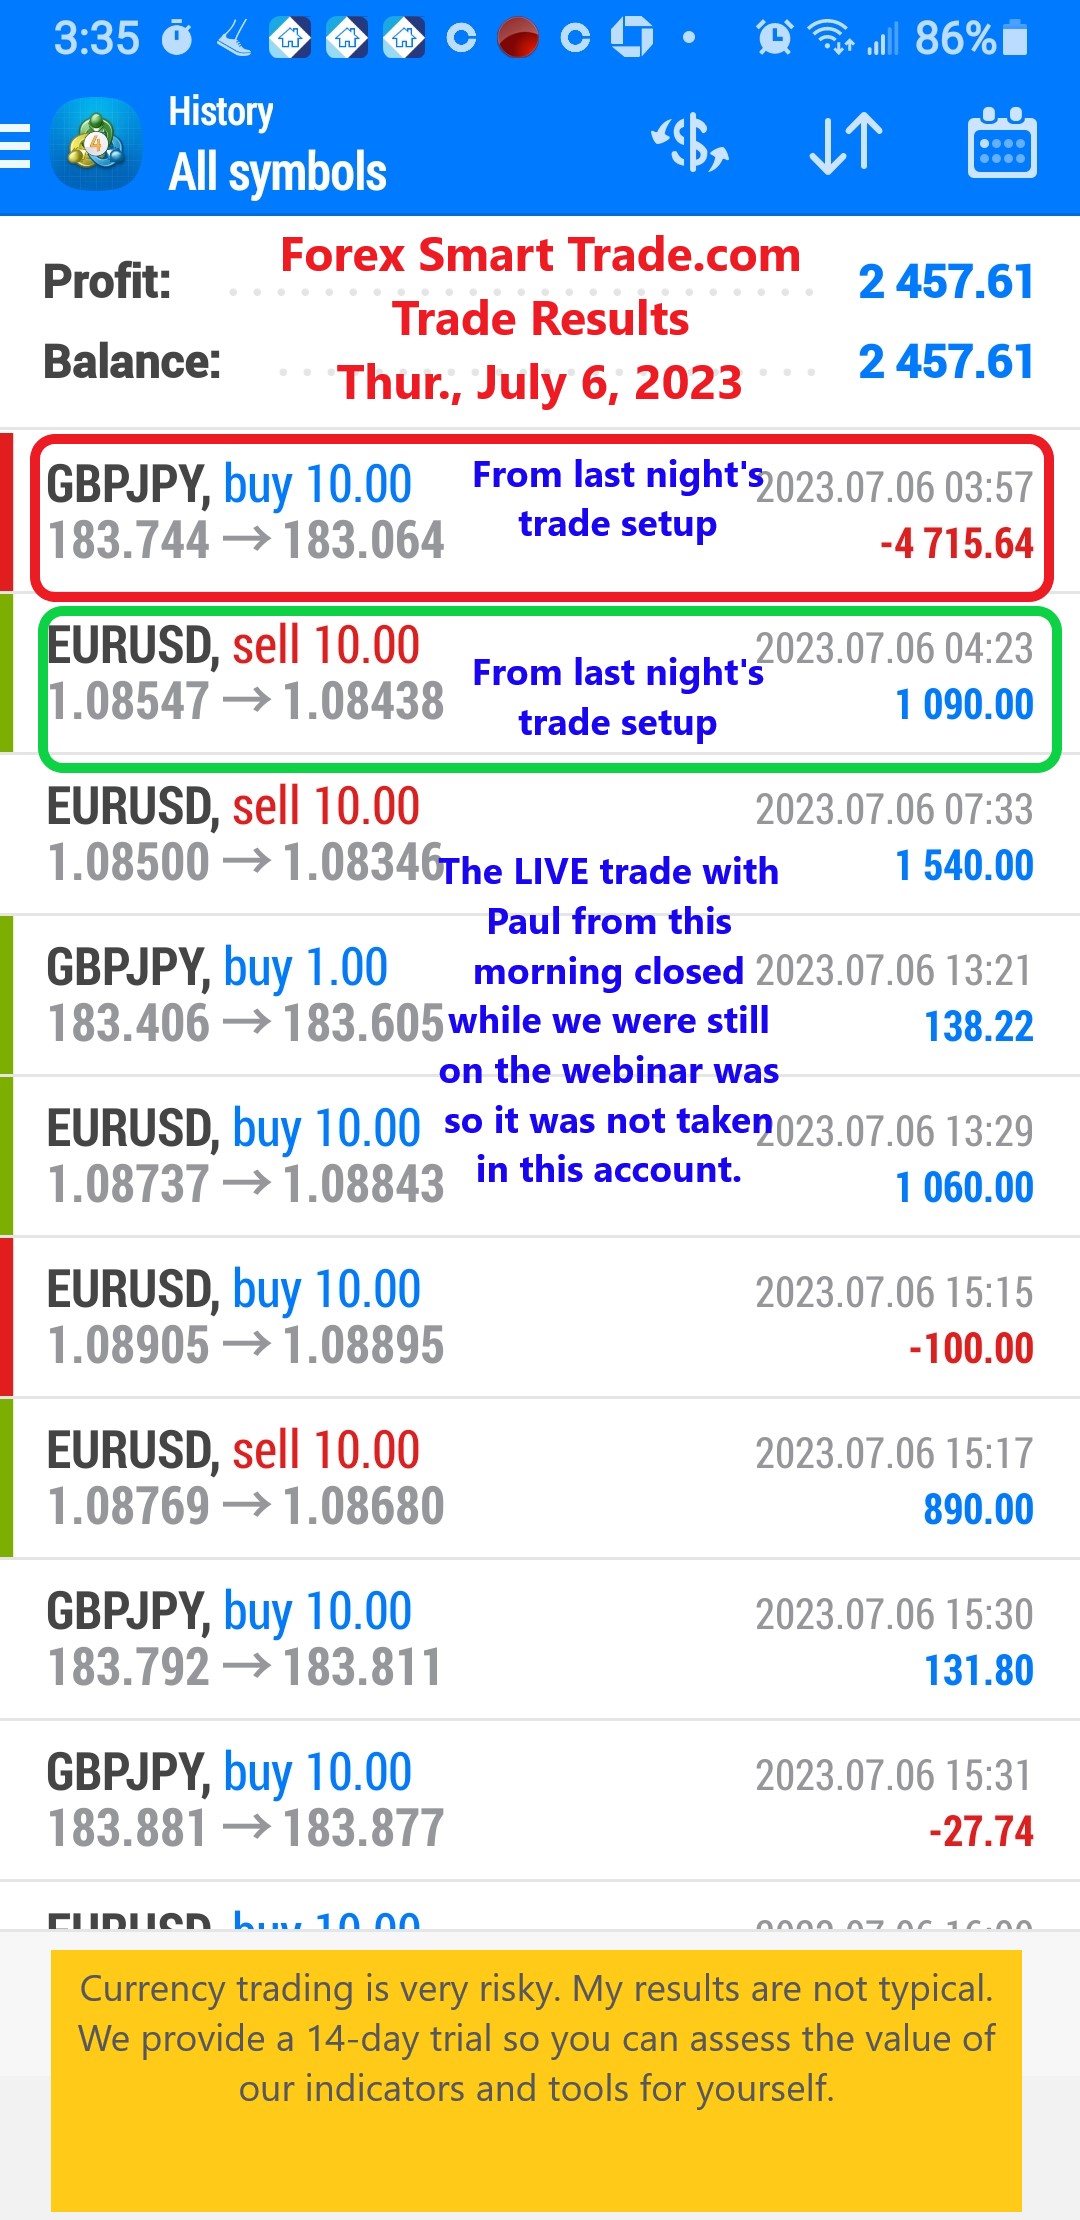
Forex Smart Trade Results, Thursday, July 6, 2023 – $2,457
Reviewing Various Technical Indicators. Let’s continue our discussion from the previous session reviewing various technical indicators. Aside from the actual profit and loss of each strategy, […]

Forex Smart Trade Results, Wednesday, July 5, 2023 – $1,347
What is the Best Technical Indicator in Forex? Let’s take a look at what is the best technical indicator in forex not counting the Forex Smart […]
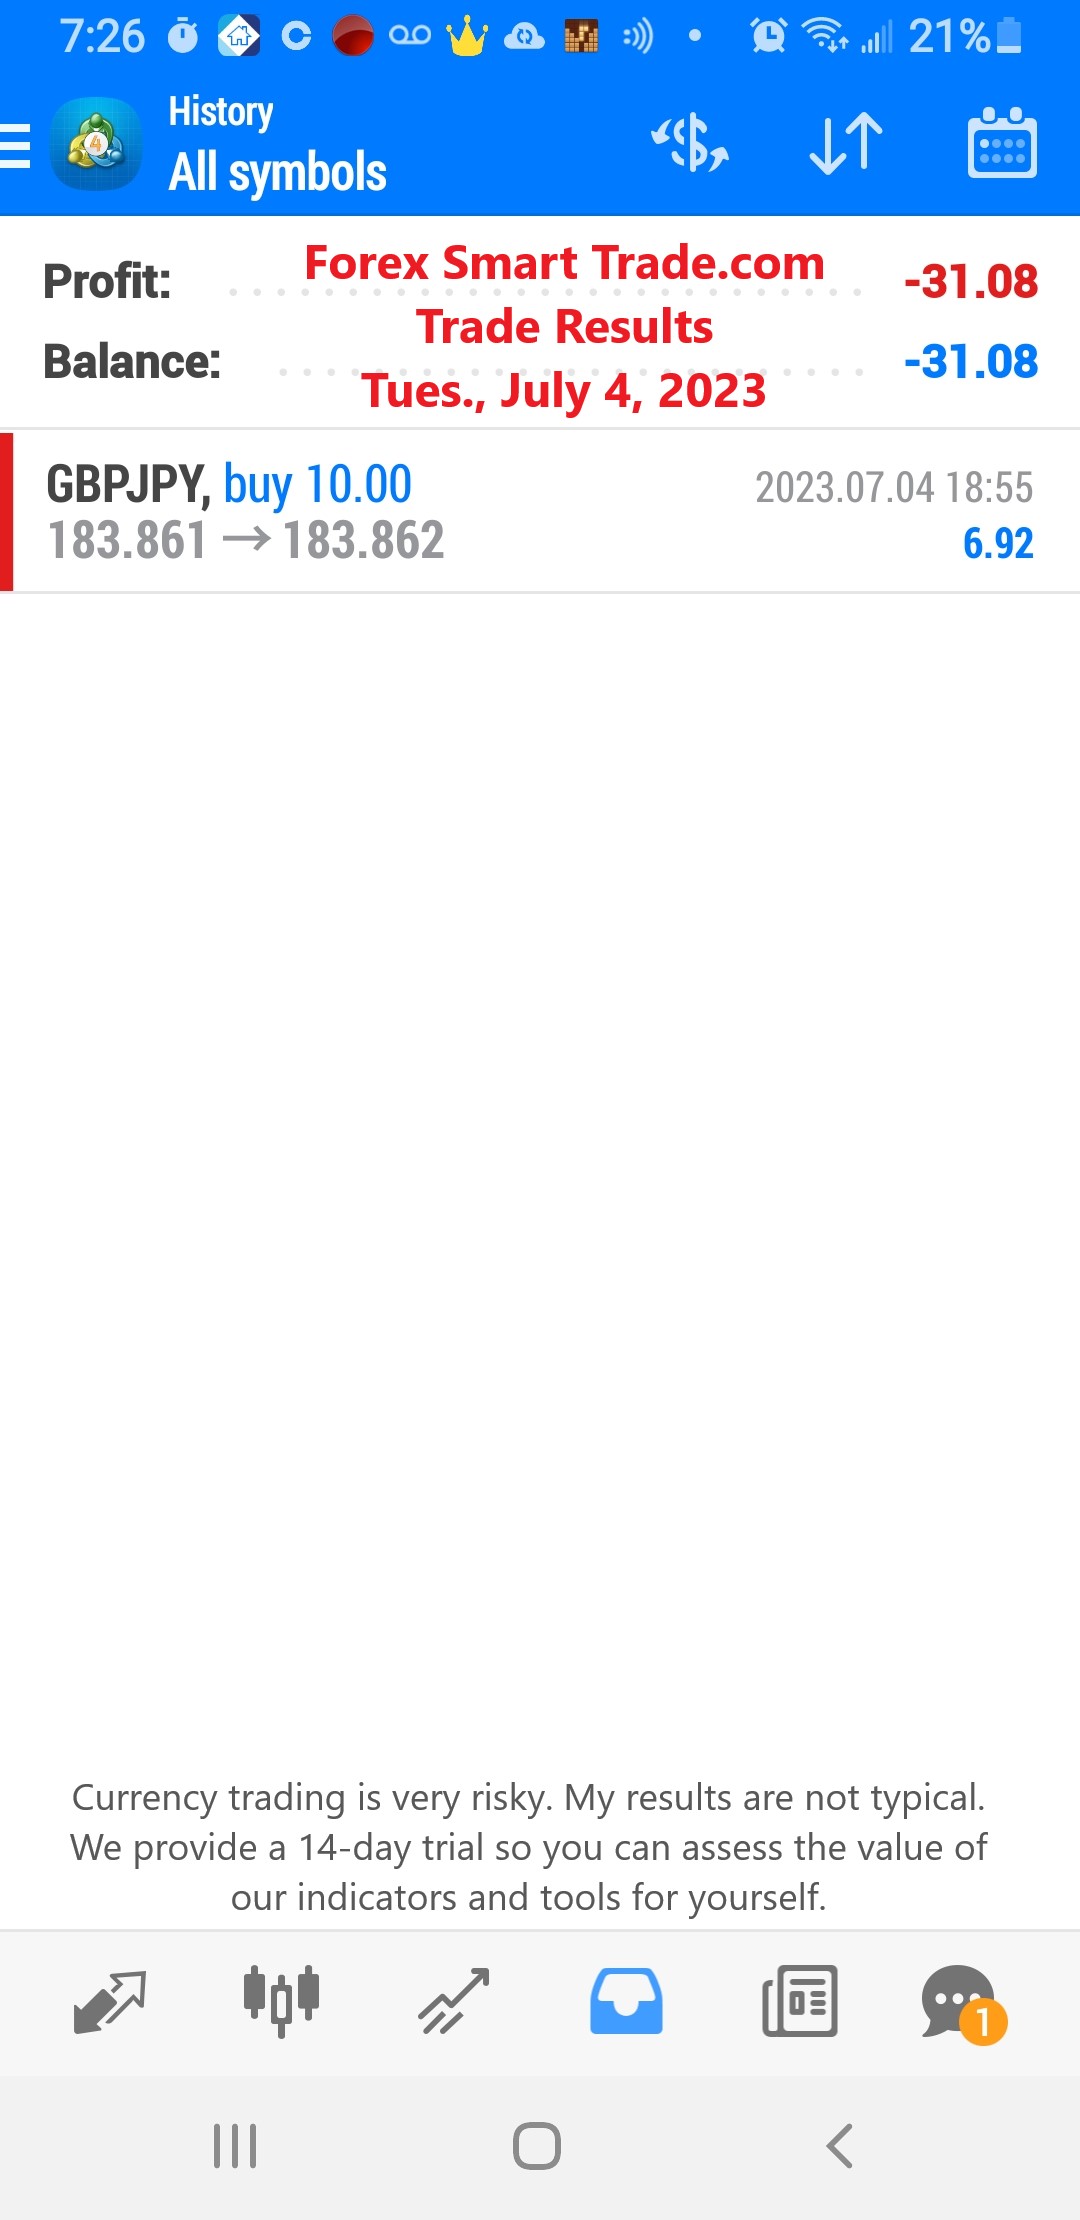
Forex Smart Trade Results, Tuesday, July 4, 2023 – ($31)
RSI + MACD. Here’s another example, with the RSI and the MACD this time. When the RSI reached the overbought area and gave a sell signal, the MACD soon followed […]
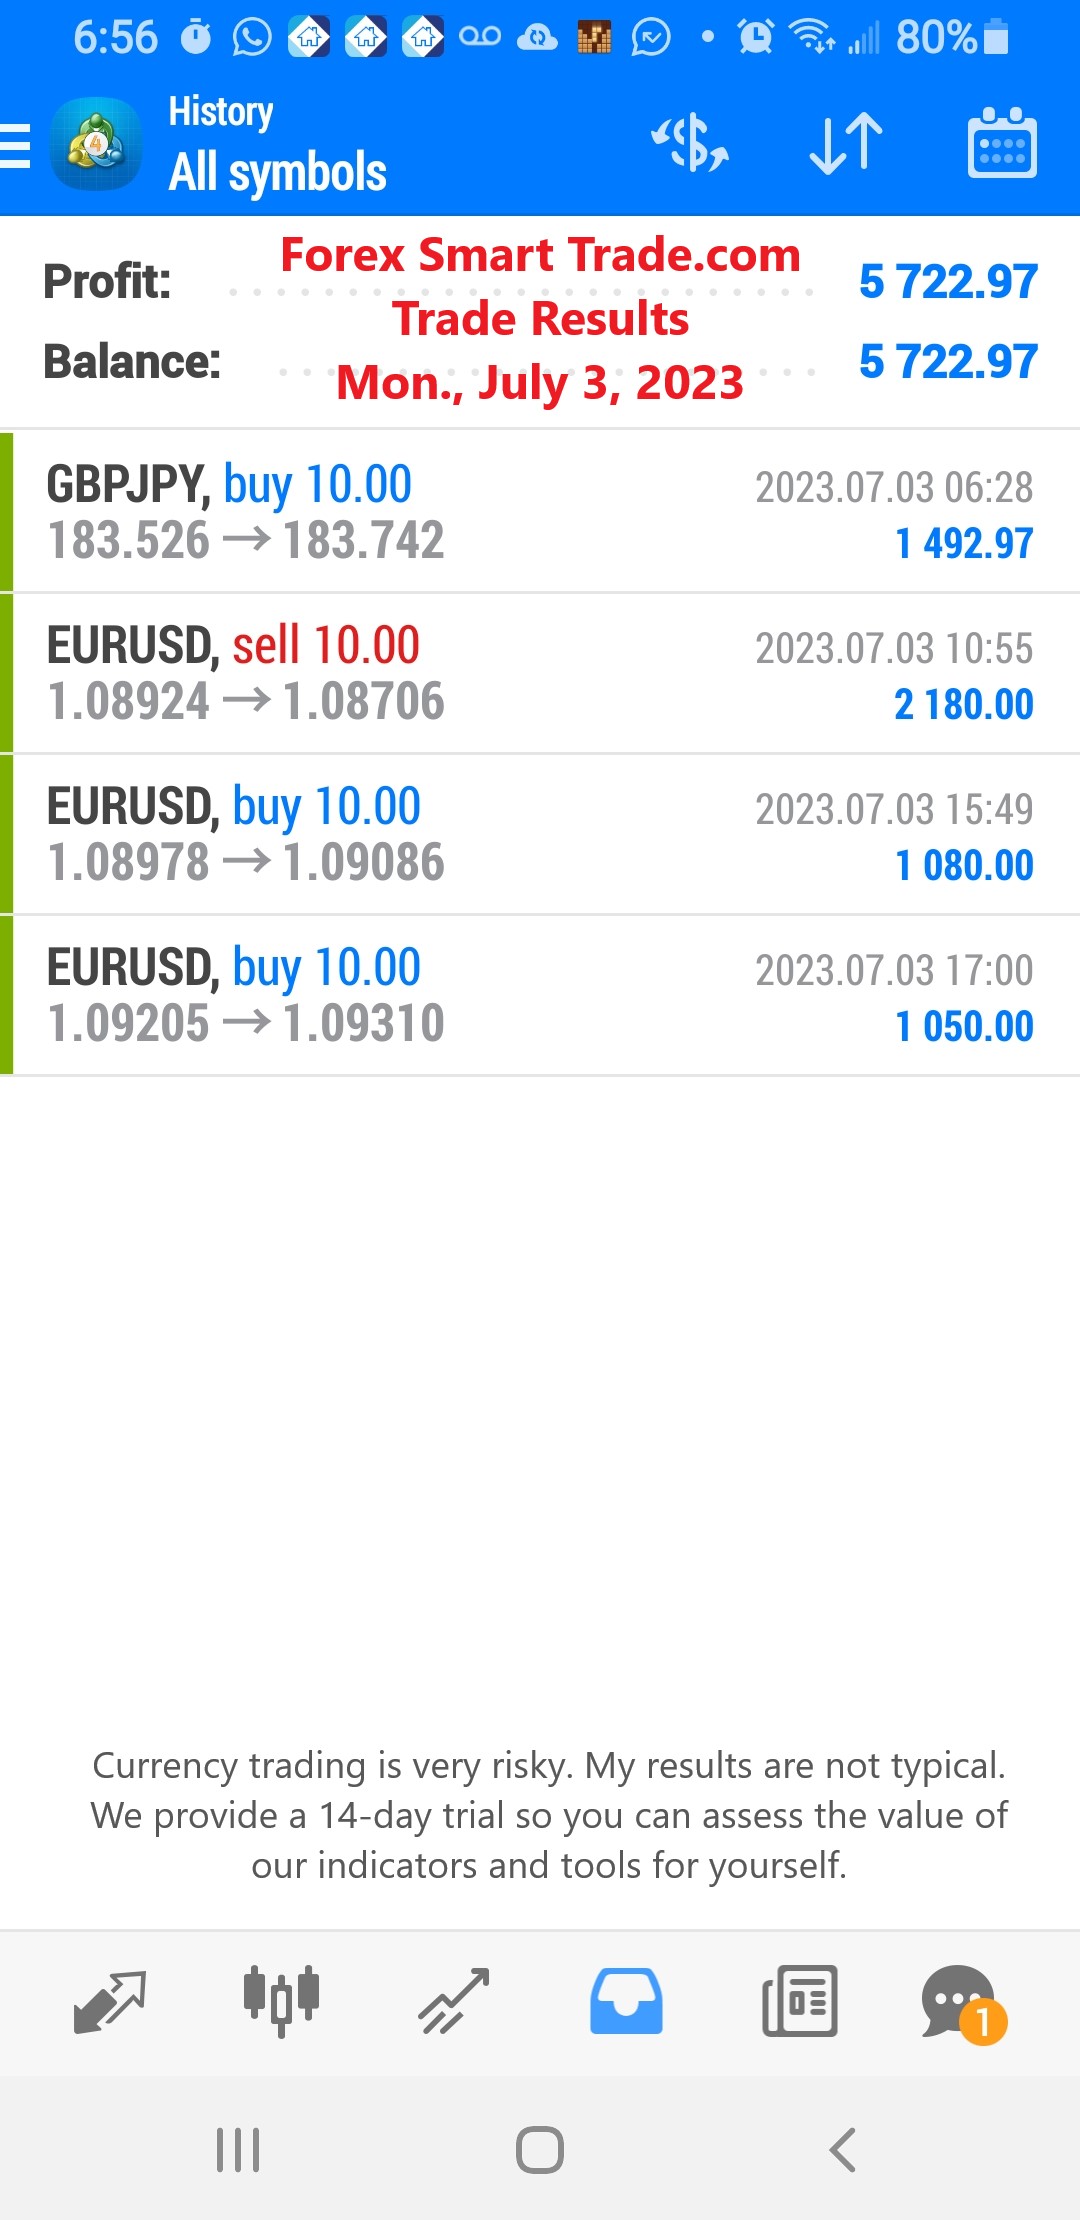
Forex Smart Trade Results, Monday, July 3, 2023 – $5,722
Trading with Multiple Chart Indicators. Let’s take a look at trading with multiple chart indicators. Now that you know how some of the most common chart […]
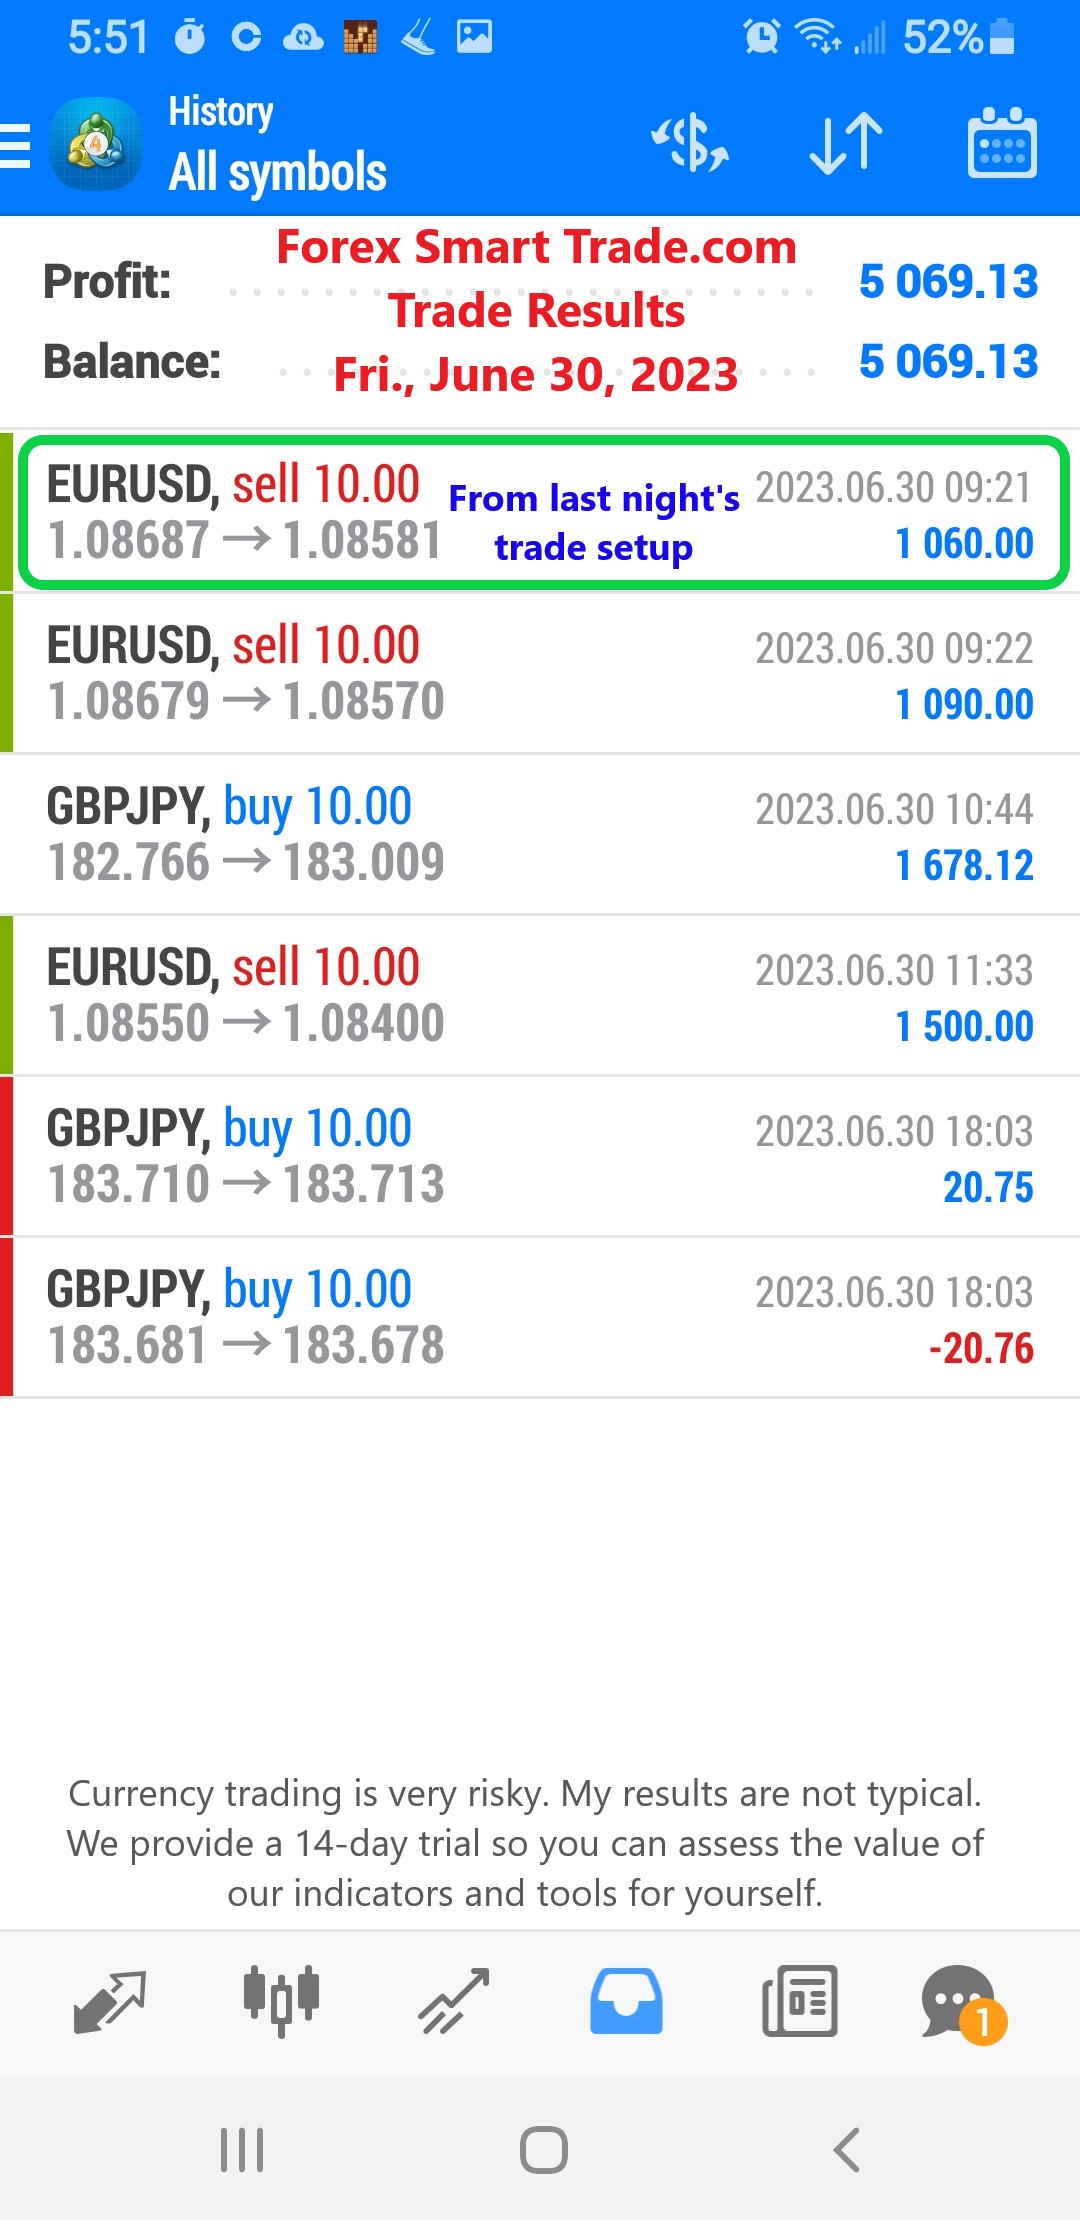
Forex Smart Trade Results, Friday, June 30, 2023 – $5,069
How to Trade Using Ichimoku Kinko Hyo. Senkou Let’s take a look at the Senkou span first. If the price is above the Senkou span, the […]
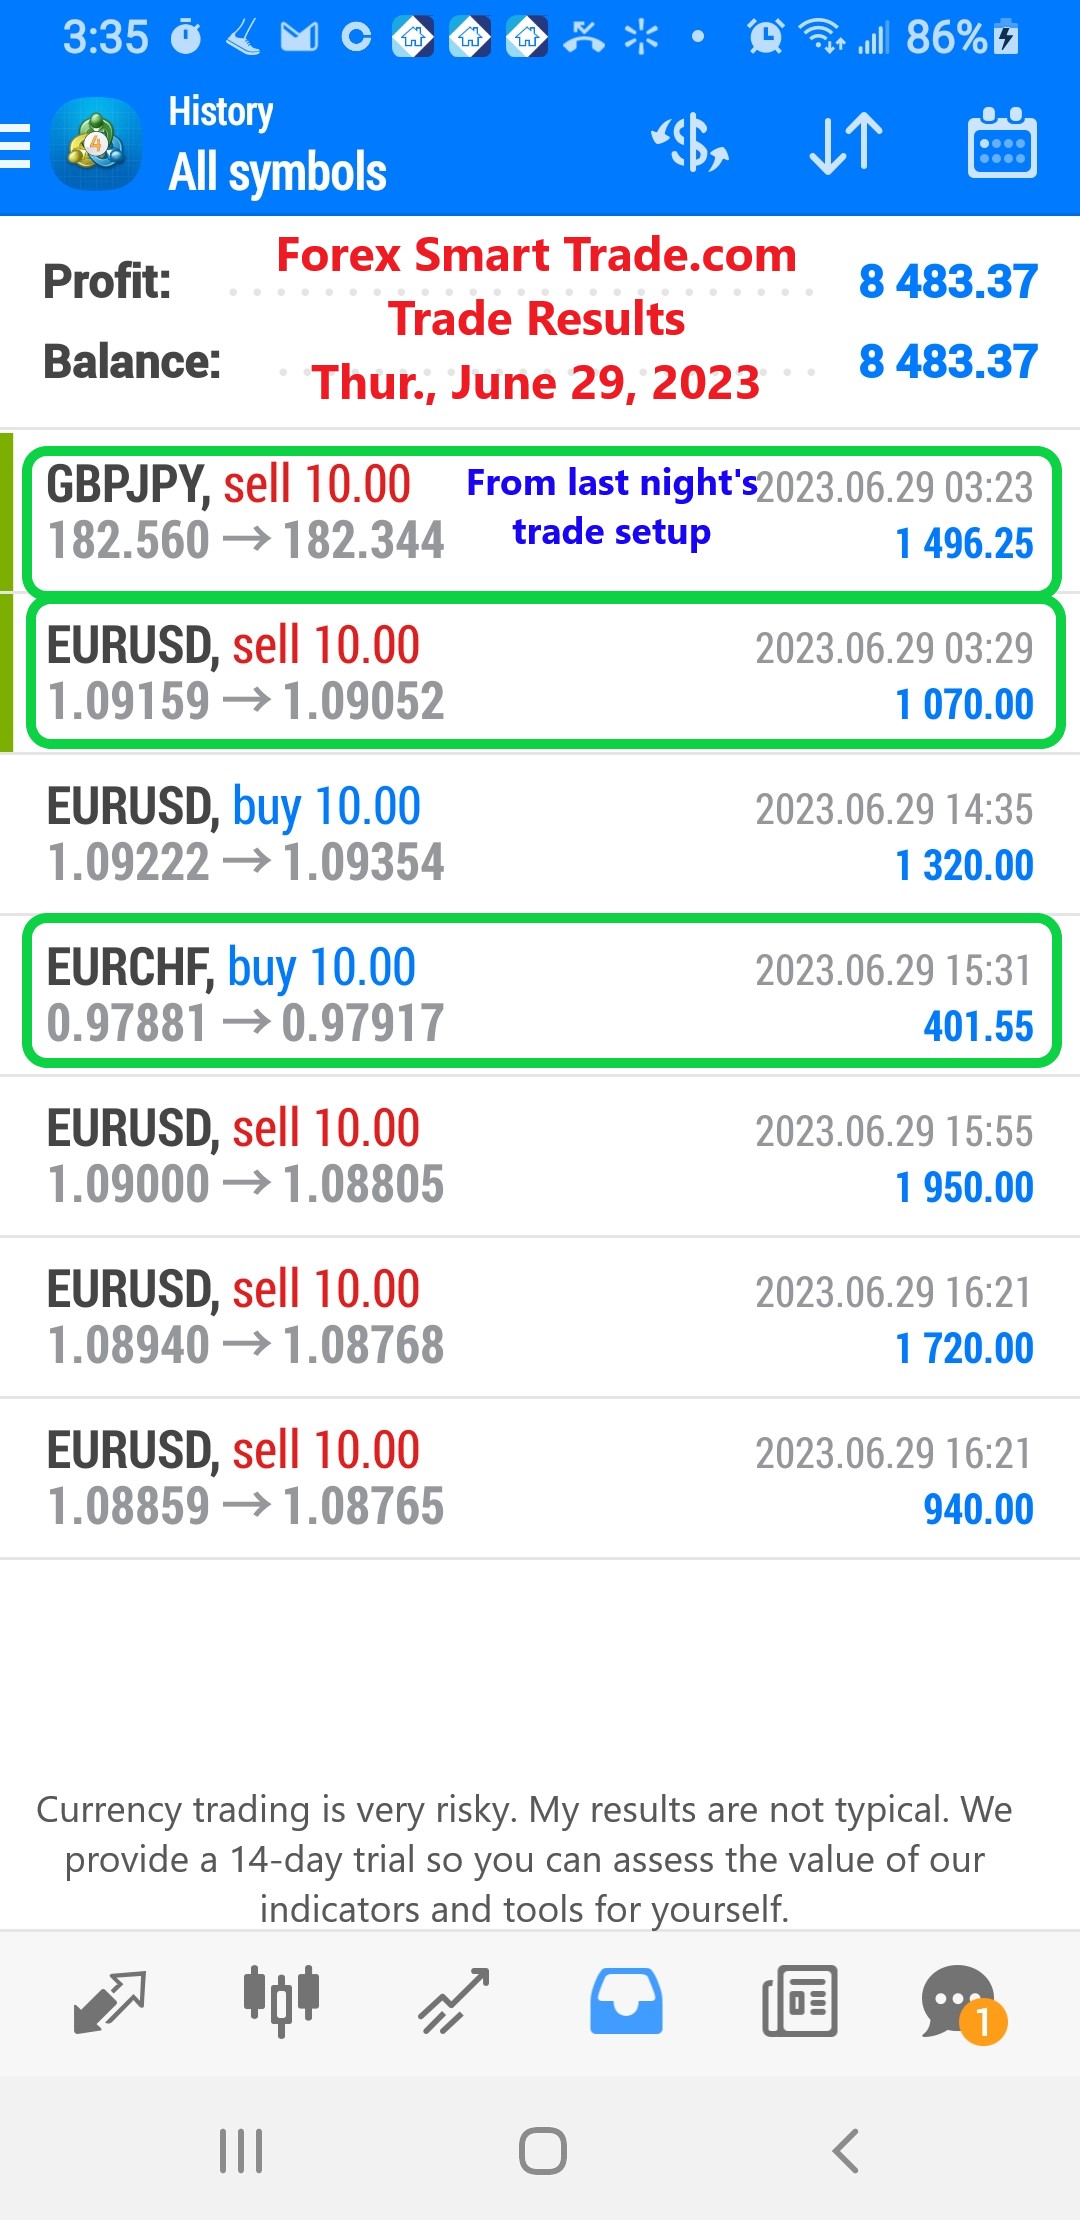
Forex Smart Trade Results, Thursday, June 29, 2023 – $8,483
More About Ichimoku Kinko Hyo. Now let’s try to find out more about Ichimoku Kinko Hyo and what each of the lines is for. Kijun Sen […]
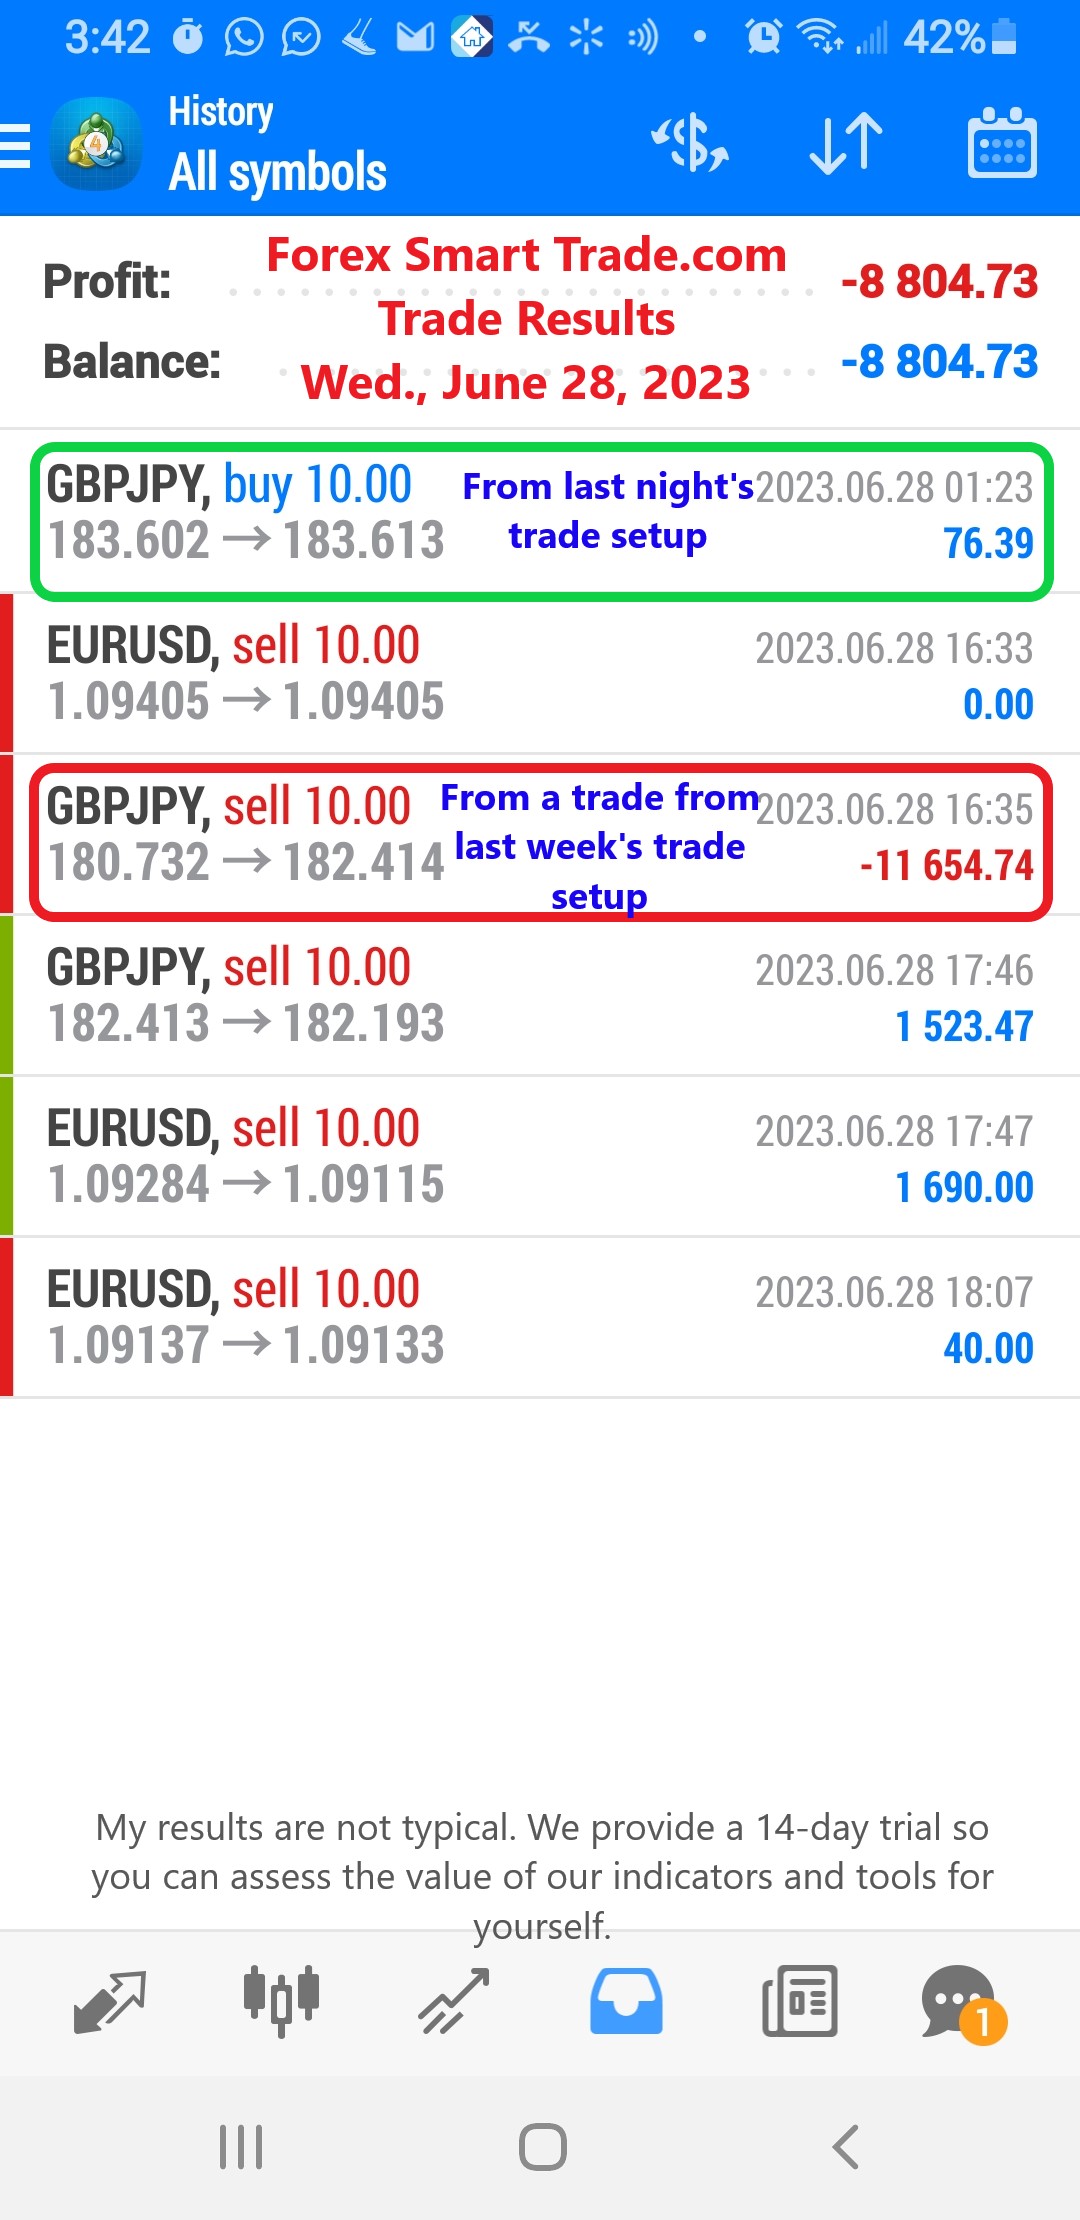
Forex Smart Trade Results, Wednesday, June 28, 2023 – ($8,804)
Ichimoku Kinko Hyo. Let’s examine a technique known as Ichimoku Kinko Hyo (IKH). No, “Ichimoku Kinko Hyo” ain’t Japanese for “May the pips be with you.” […]
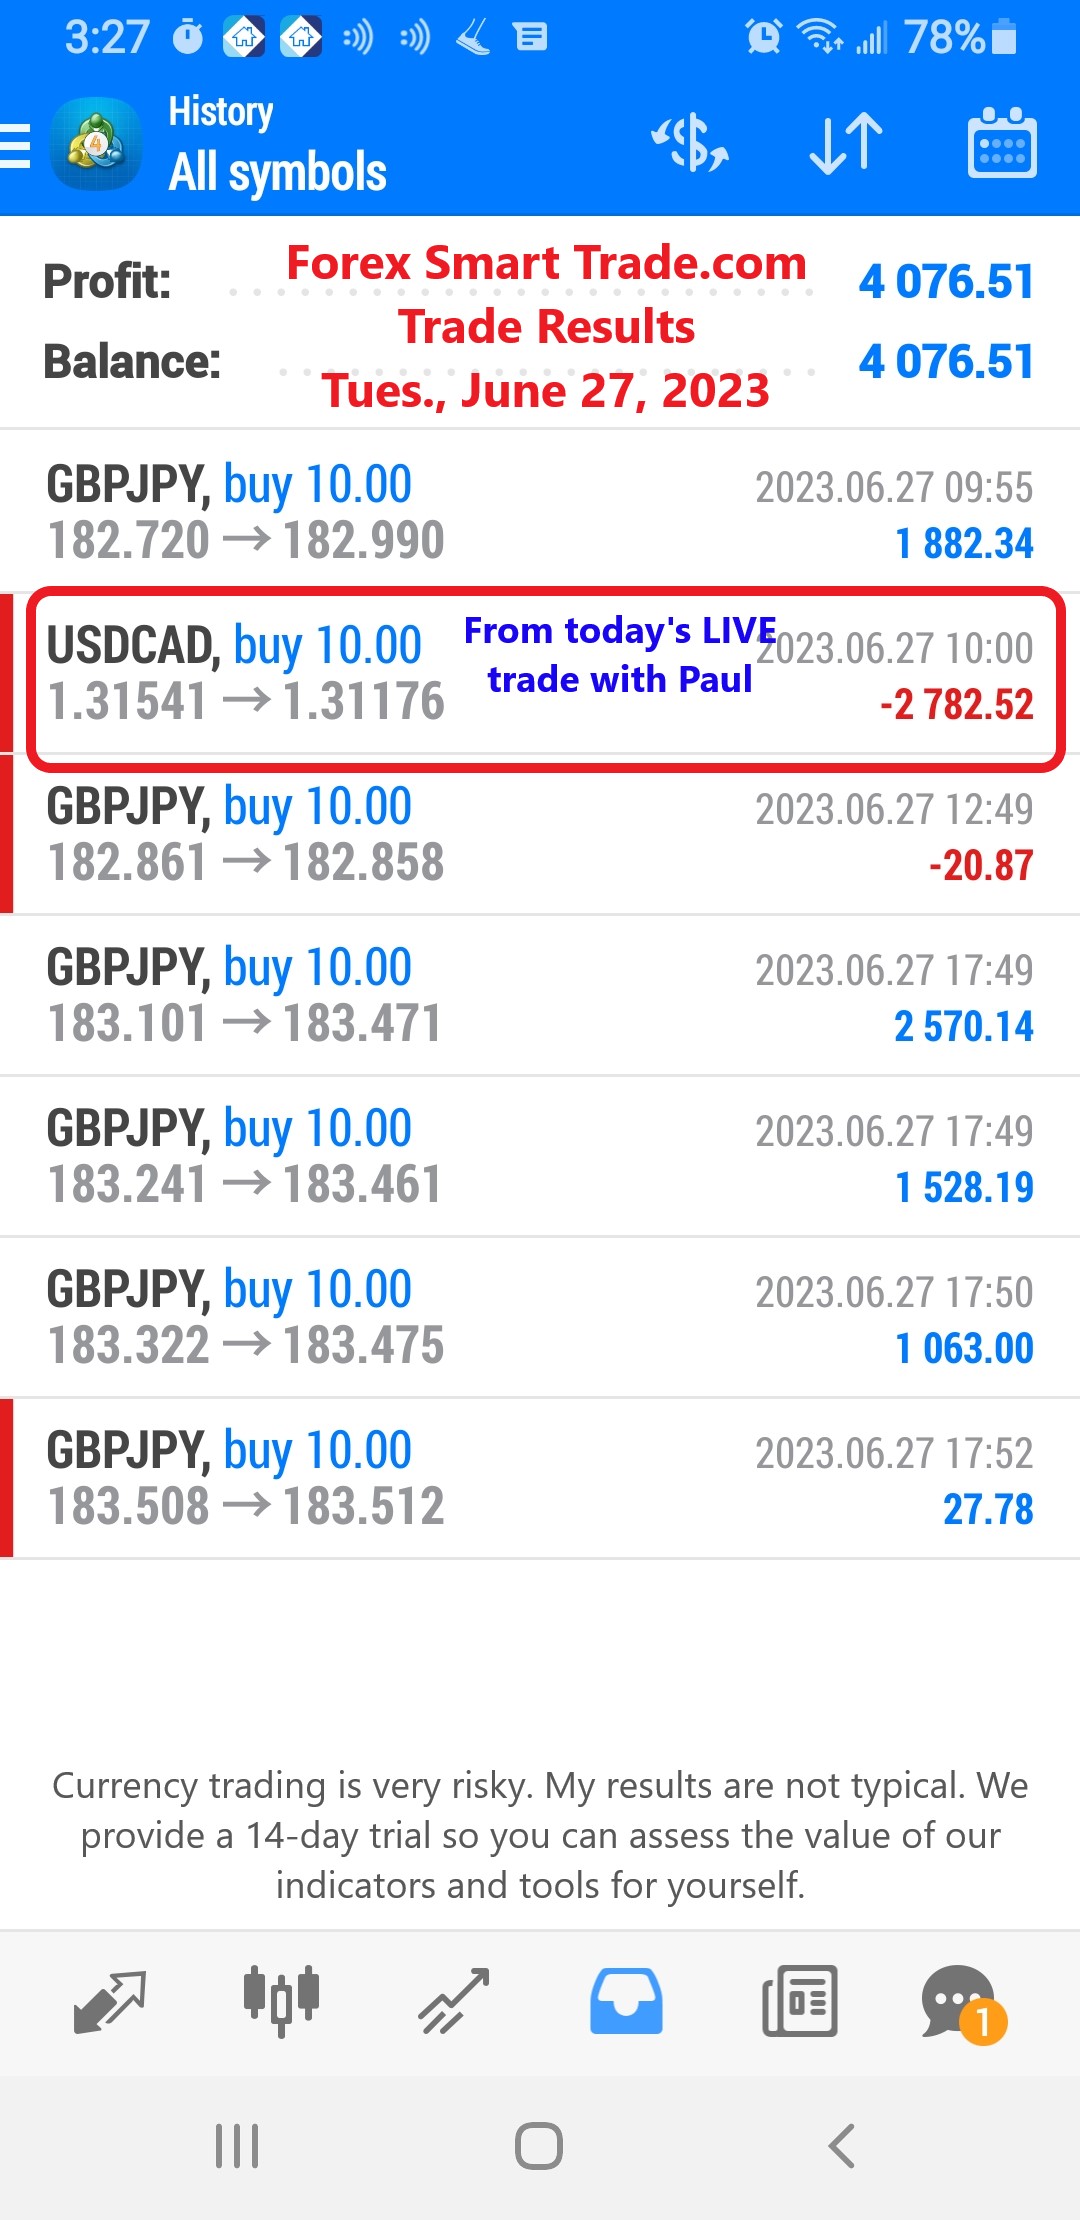
Forex Smart Trade Results, Tuesday, June 27, 2023 – $4,076
How to Trade Using ADX. One way to trade using ADX is to wait for breakouts first before deciding to go long or short. They can use ADX […]
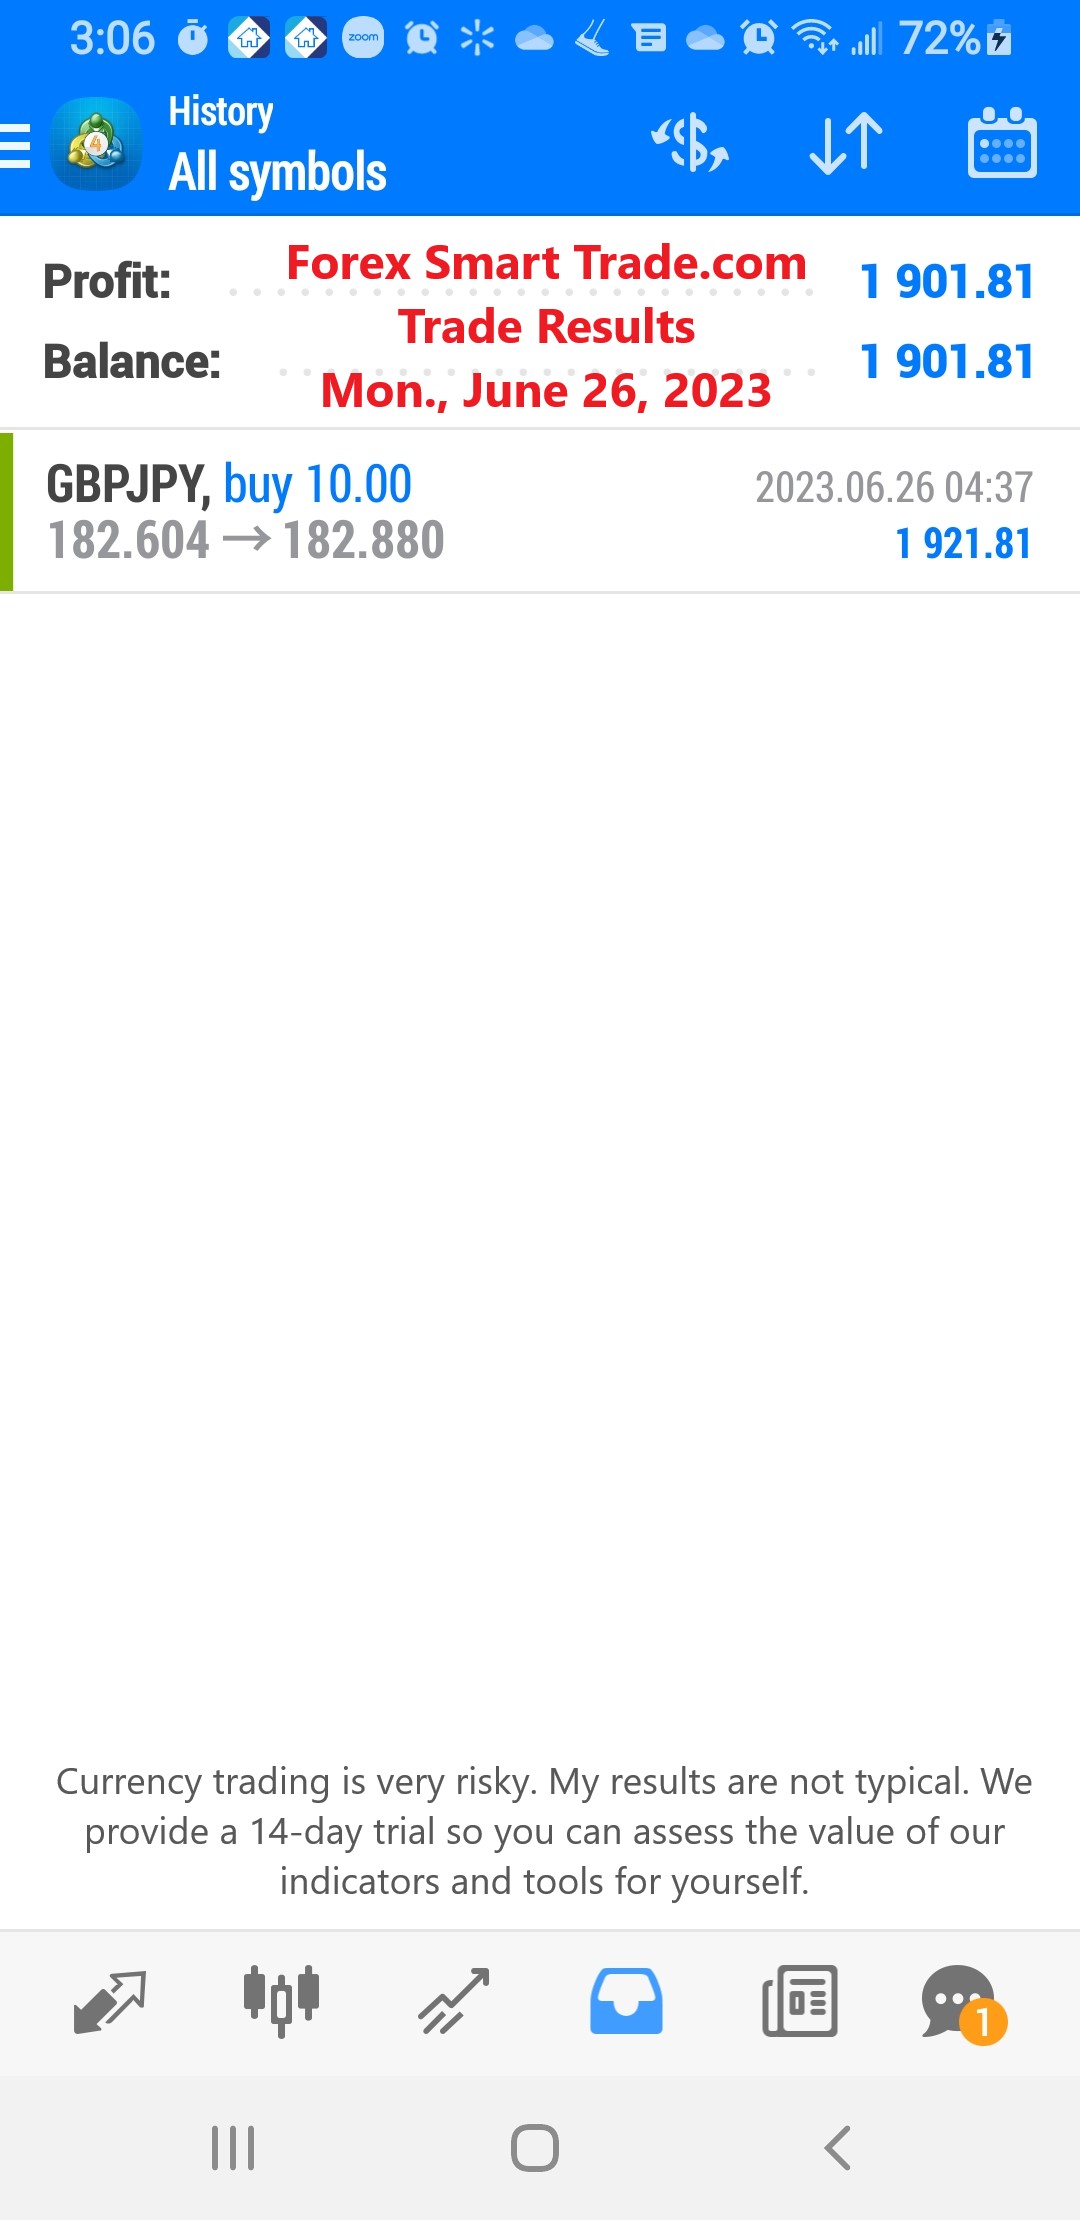
Forex Smart Trade Results, Monday, June 26, 2023 – $1,901
How to Use ADX. When you’re using the ADX indicator, keep an eye on the 20 and 40 as key levels. here’s a little cheat sheet […]
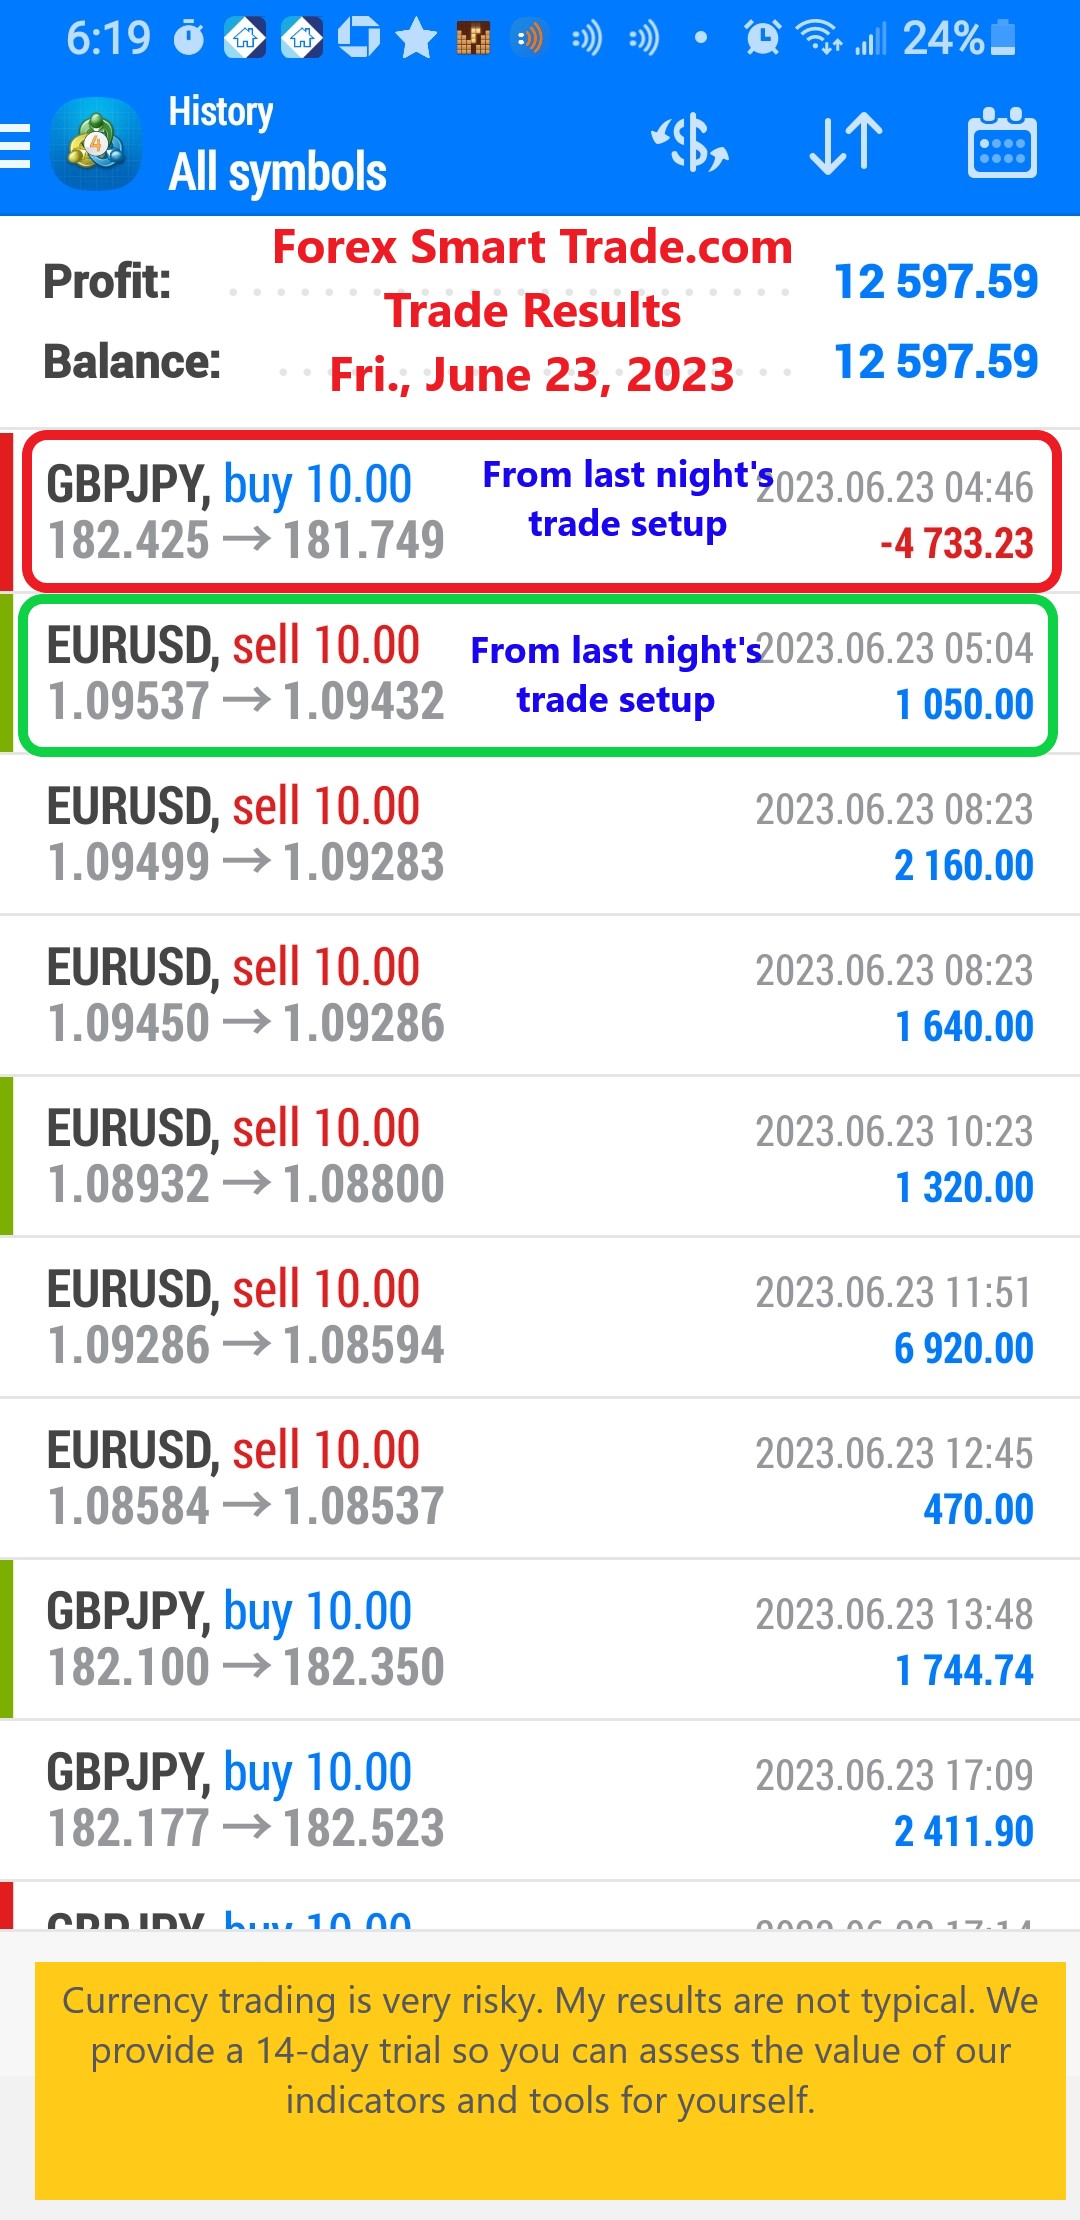
Forex Smart Trade Results, Friday, June 23, 2023 – $12,597
How to Use ADX (Average Directional Index). Let’s take a look at how to use the ADX (average directional index). When trading, it’s helpful to gauge […]
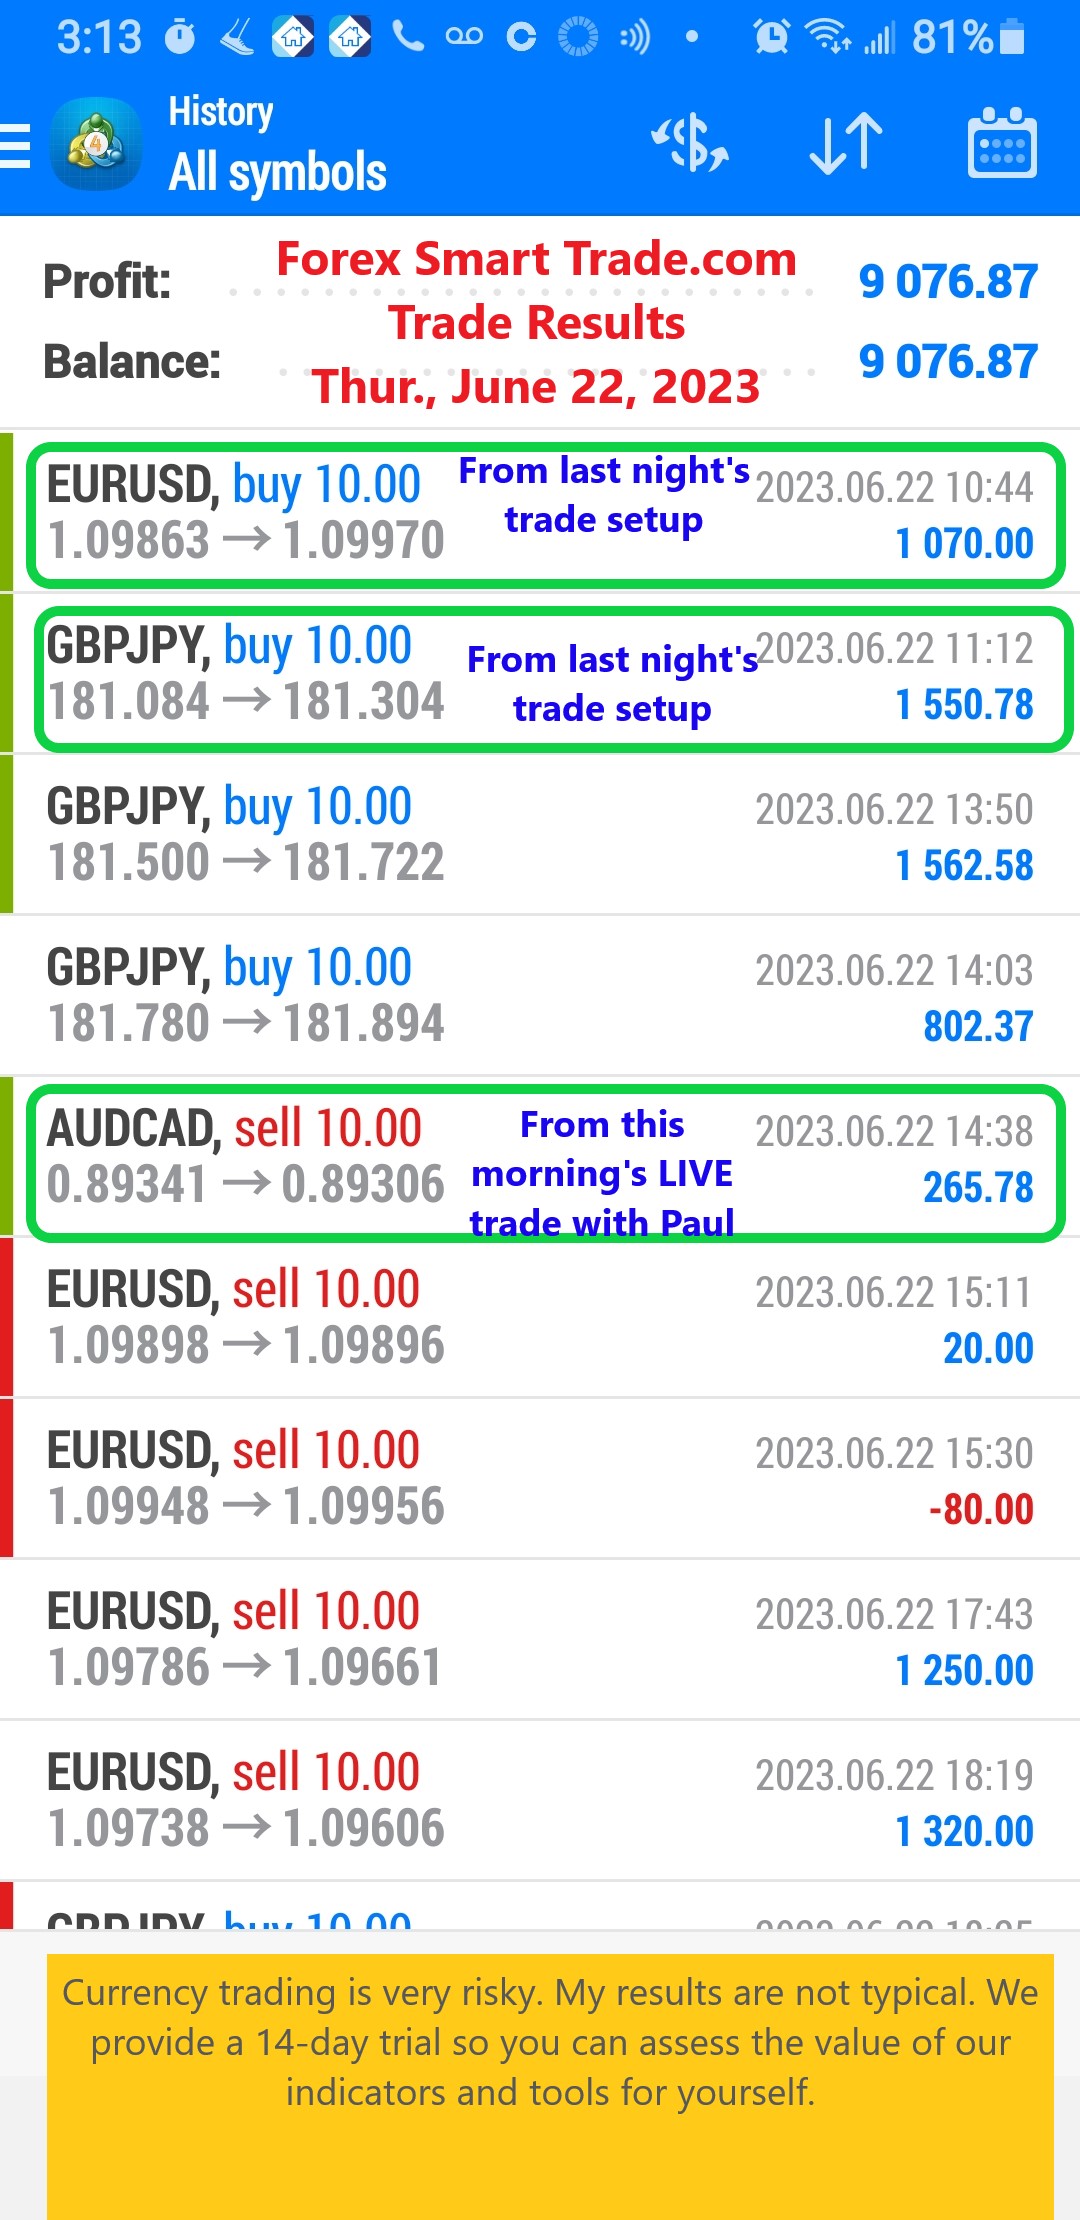
Forex Smart Trade Results, Thursday, June 22, 2023 – $9,076
Determining Trend Strength Using %R. Let’s look at determining trend strength using %R. Williams %R’s sensitivity to volatile prices comes in handy when you want to […]
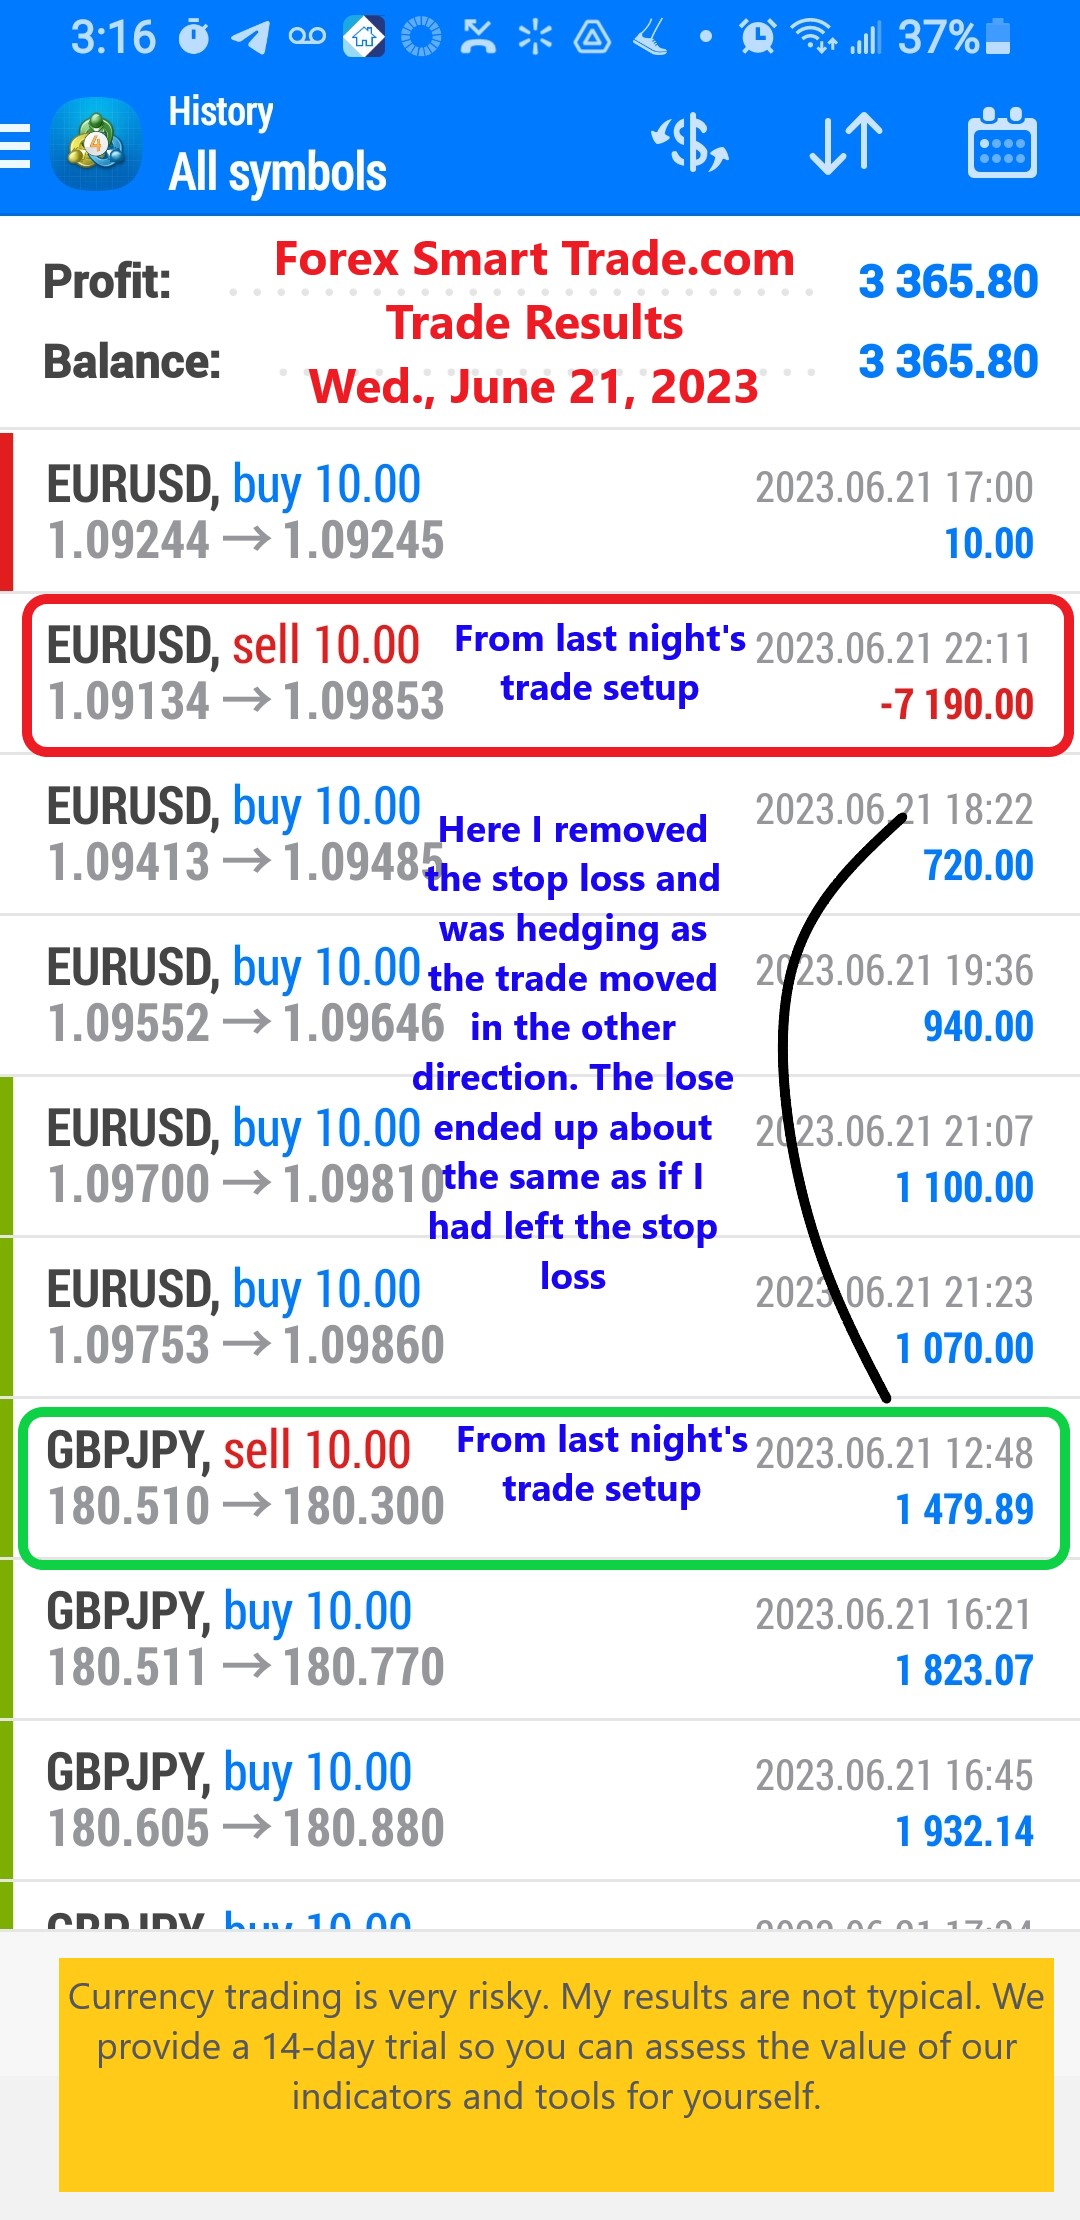
Forex Smart Trade Results, Wednesday, June 21, 2023 – $3,365
How to Use Williams %R (Williams Percent Range). The Williams Percent Range, also called Williams %R, is a momentum indicator that shows you where the last closing price is relative […]
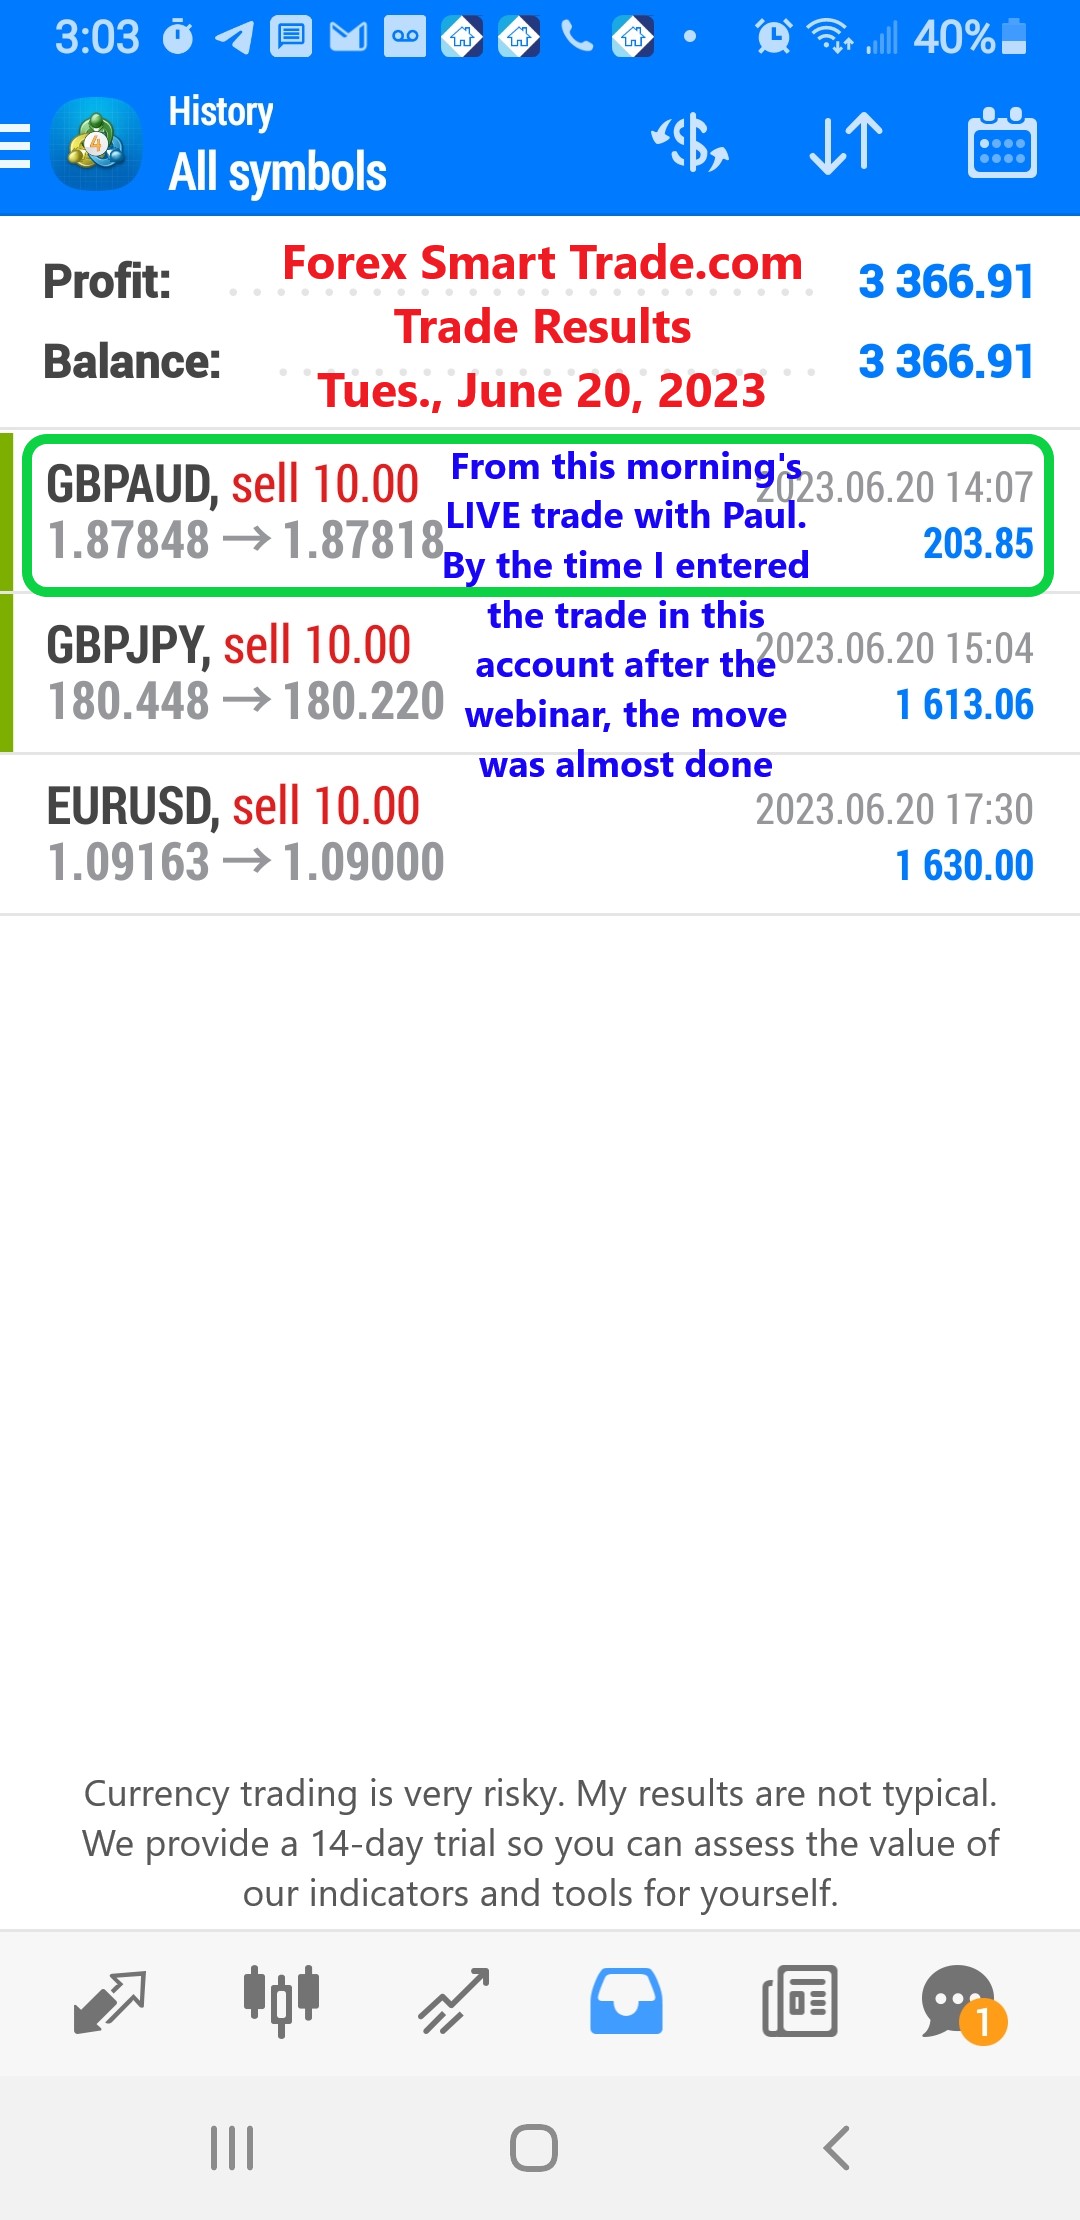
Forex Smart Trade Results, Tuesday, June 20, 2023 – $3,366
How to Trade Using RSI. RSI can be used just like the Stochastic indicator. We can use it to pick potential tops and bottoms depending on whether […]
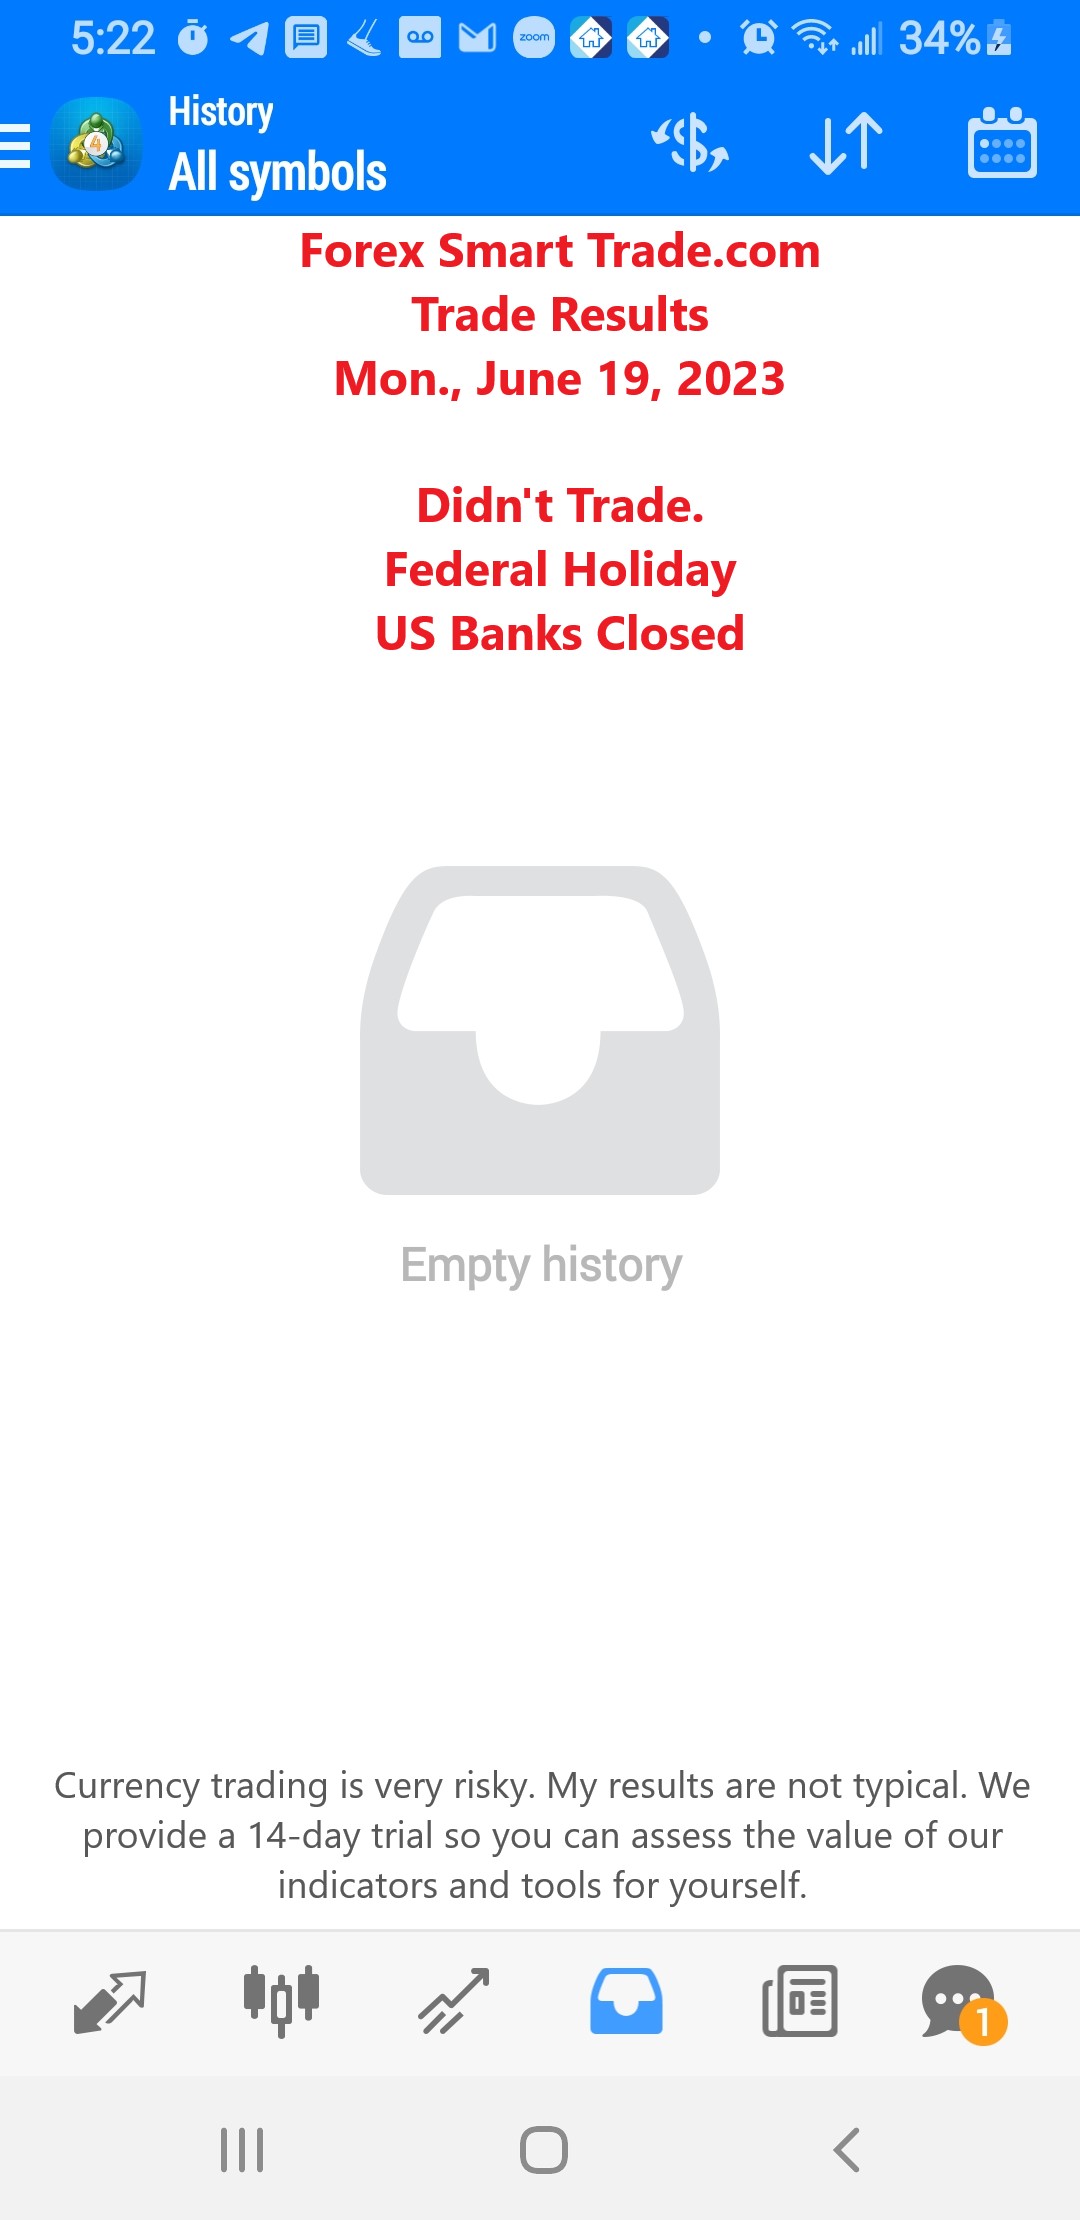
Forex Smart Trade Results, Monday, June 19, 2023 – $0 – Federal Holiday
How to Use RSI (Relative Strength Index). Relative Strength Index, or RSI, is a popular indicator developed by a technical analyst named J. Welles Wilder. The RSI […]
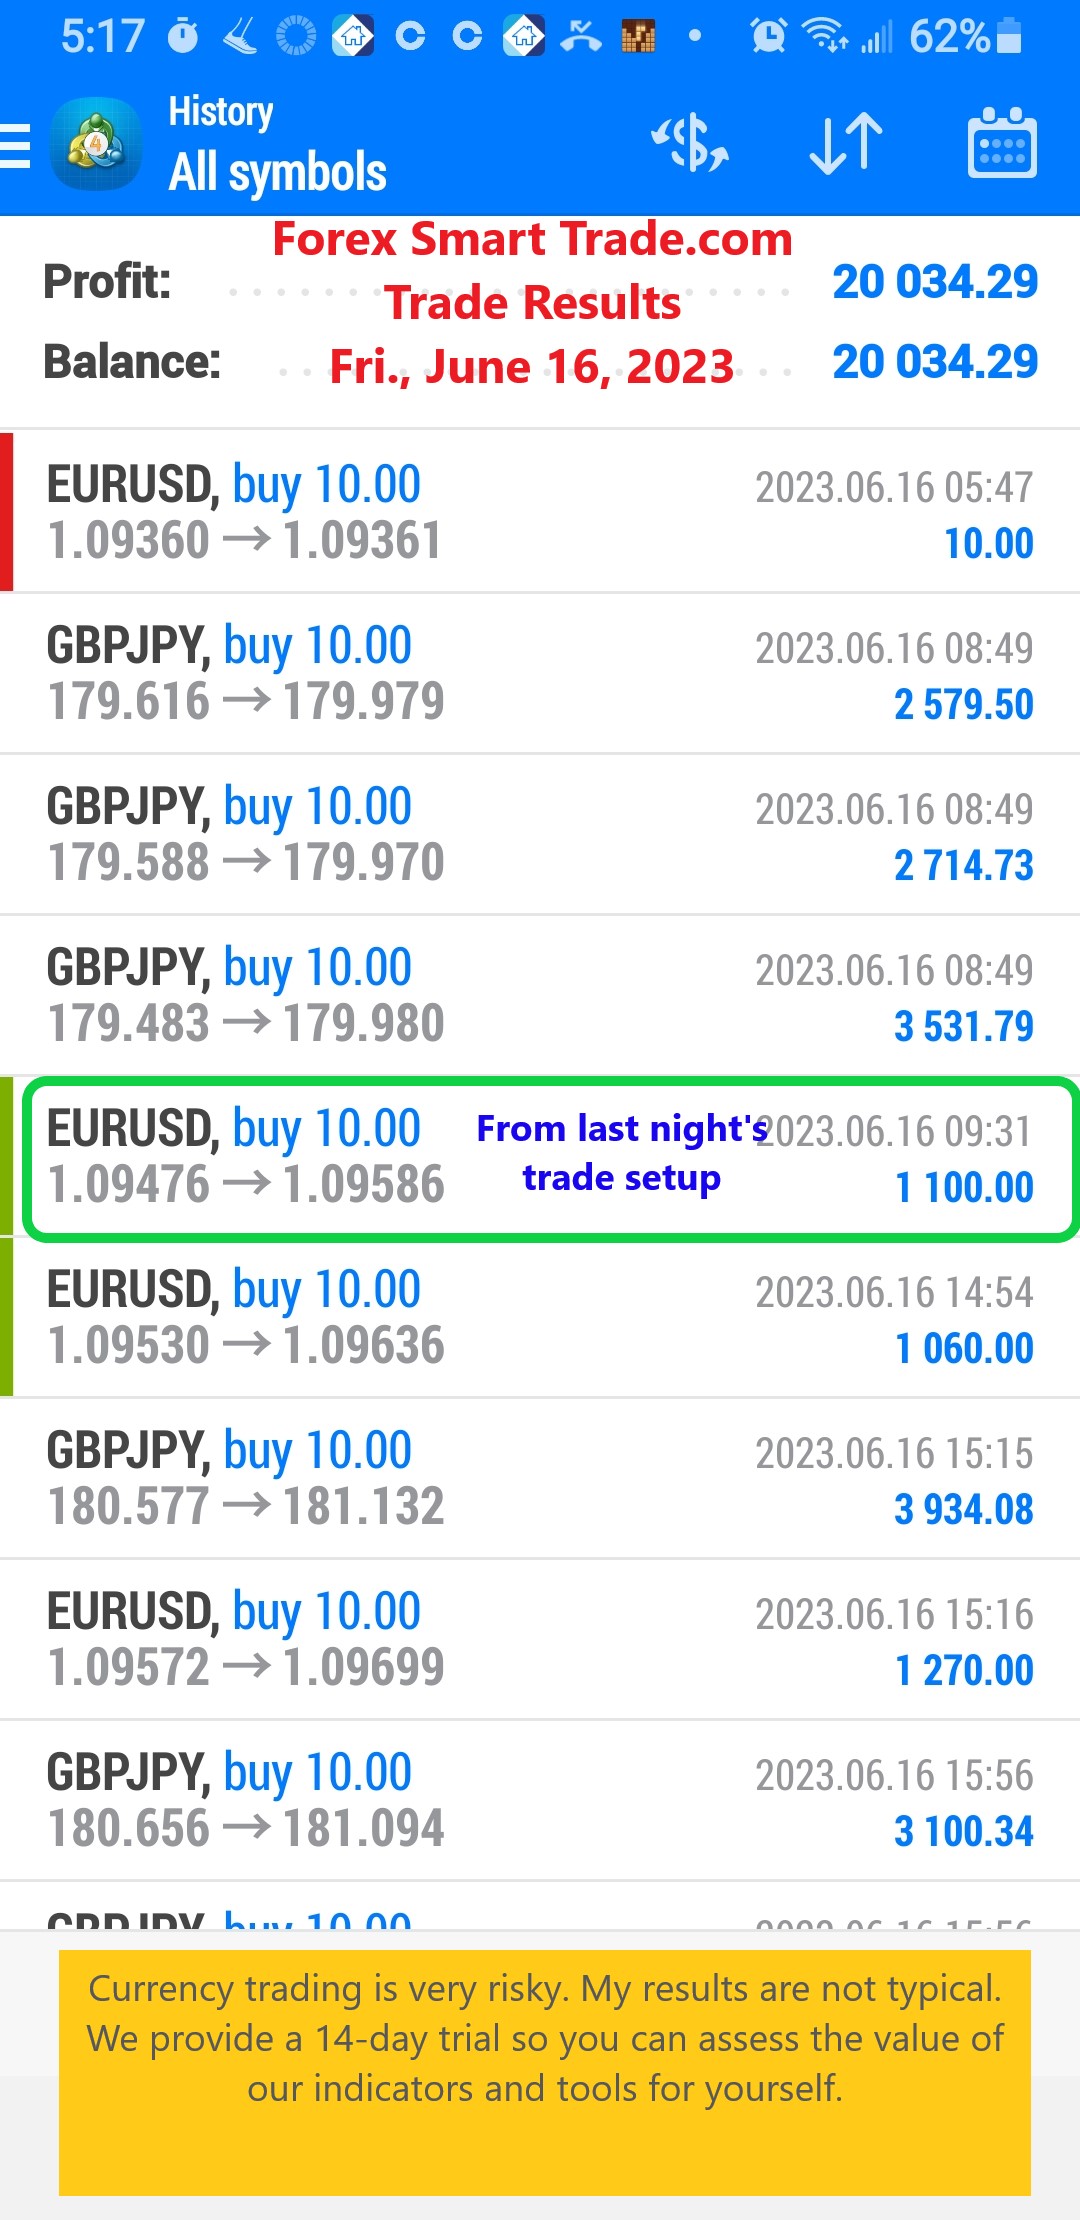
Forex Smart Trade Results, Friday, June 16, 2023 – $20,034
How to Trade Forex Using the Stochastic Indicator. The Stochastic technical indicator tells us when the market is overbought or oversold. The Stochastic is scaled from 0 to 100. […]
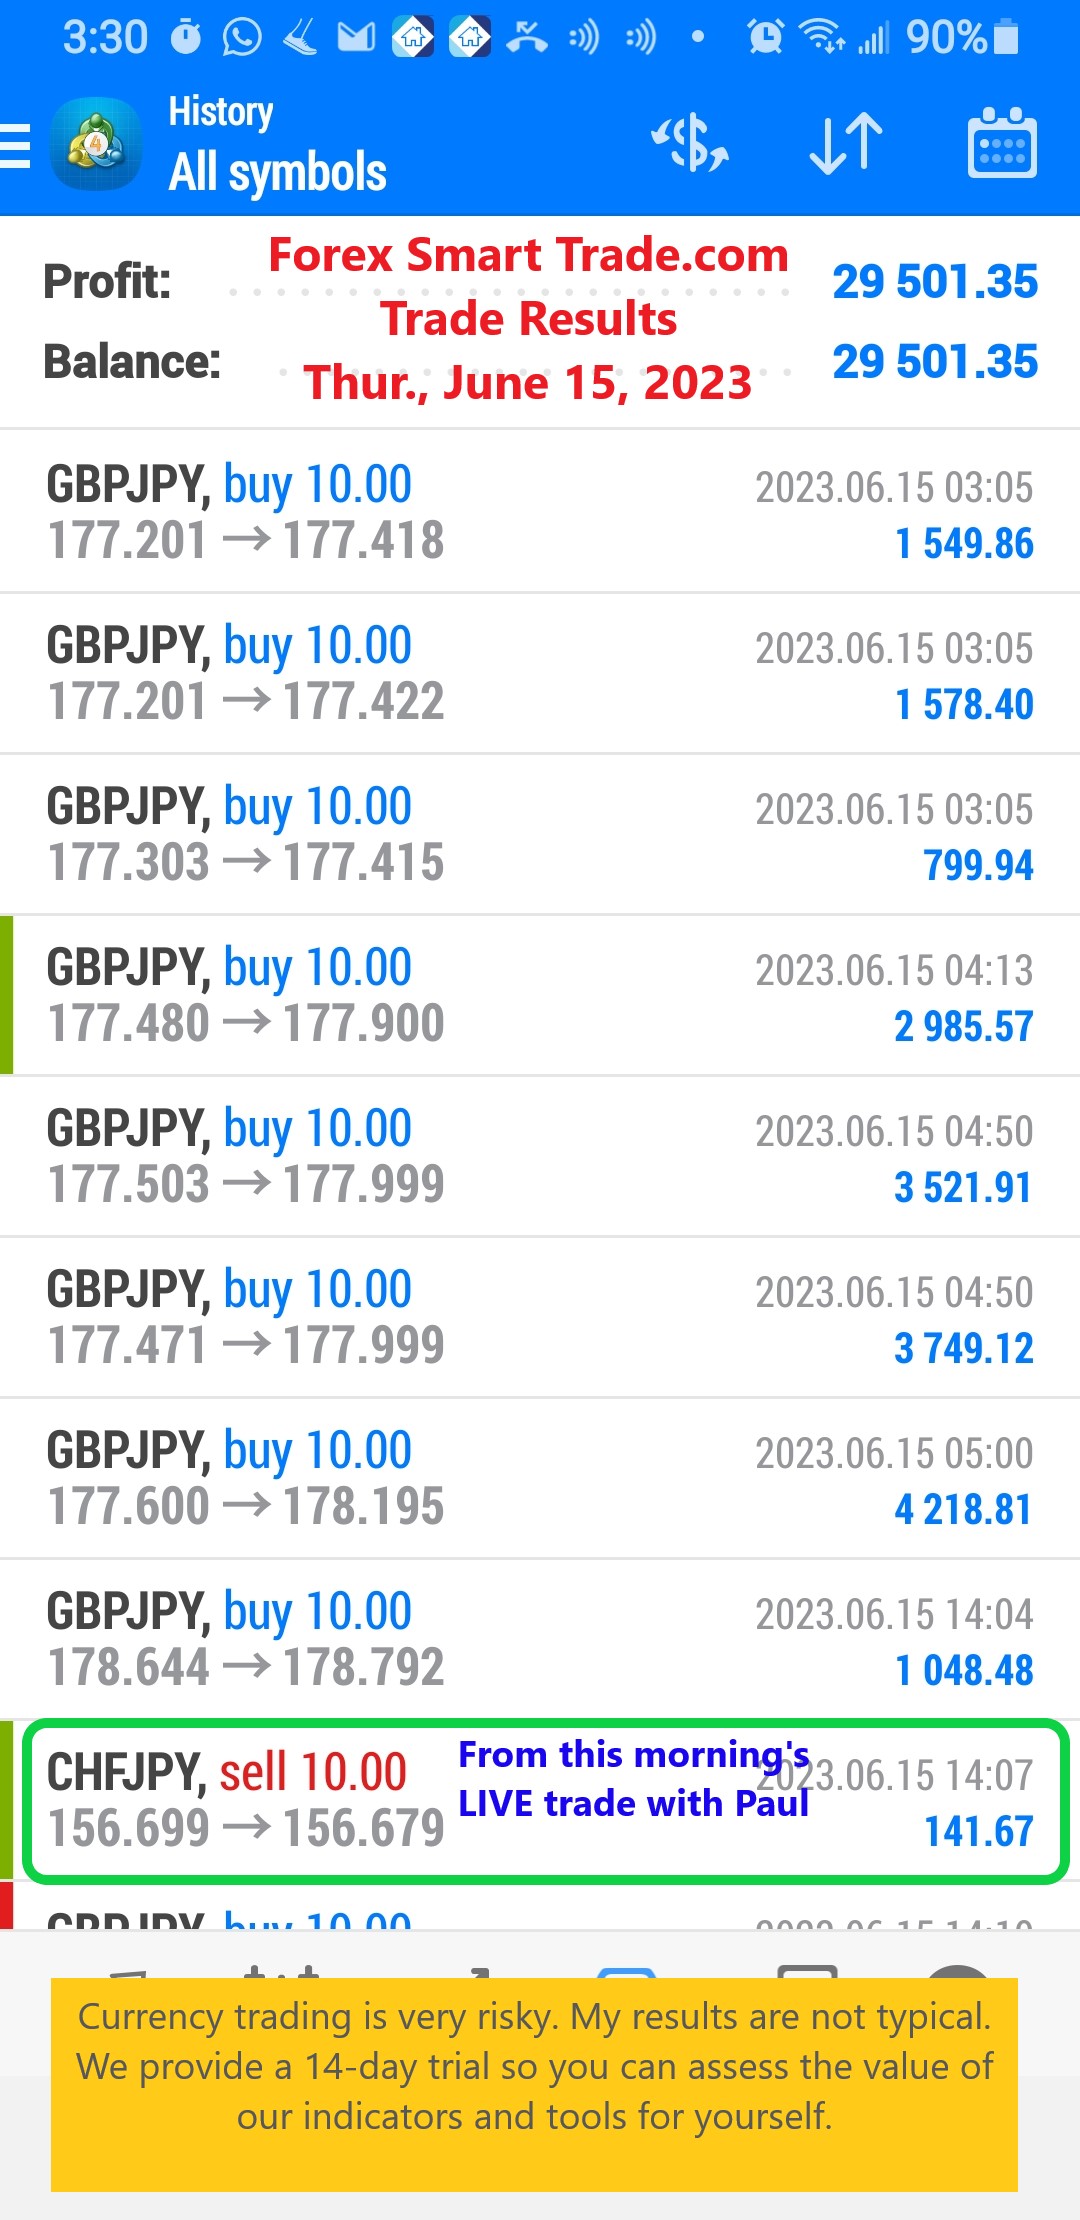
Forex Smart Trade Results, Thursday, June 15, 2023 – $29,501
How to Use the Stochastic Indicator. The Stochastic oscillator is another technical indicator that helps traders determine where a trend might be ending. The oscillator works on the […]
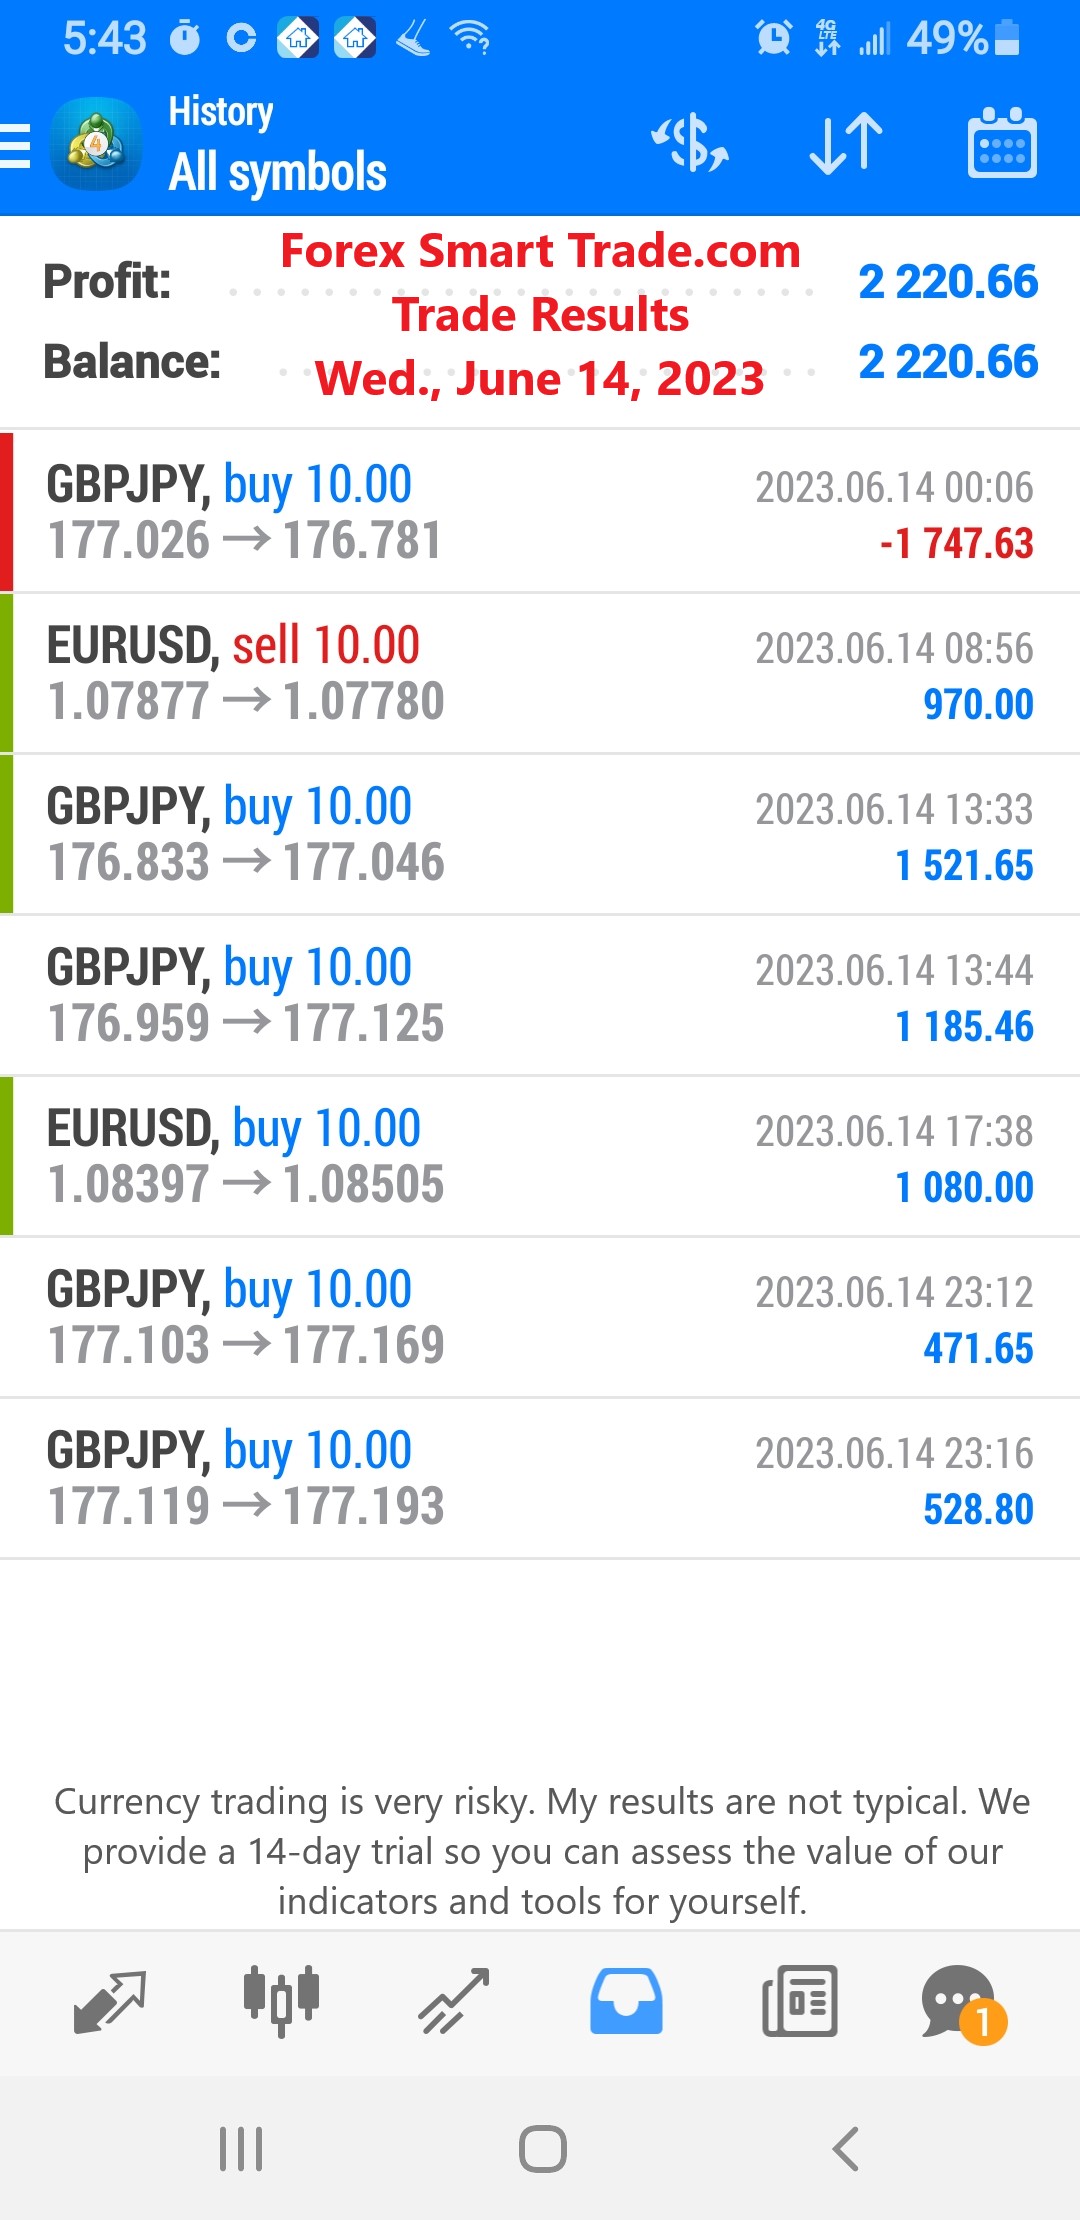
Forex Smart Trade Results, Wednesday, June 14, 2023 – $2,220
How to use Parabolic SAR to exit trades. Now let’s review how to use parabolic SAR to exit trades. You can also use Parabolic SAR to […]

Forex Smart Trade Results, Tuesday, June 13, 2023 – $11,055
How to Use Parabolic SAR. Let’s take a look at how to use parabolic SAR. Up until now, we’ve looked at technical indicators that mainly focus […]
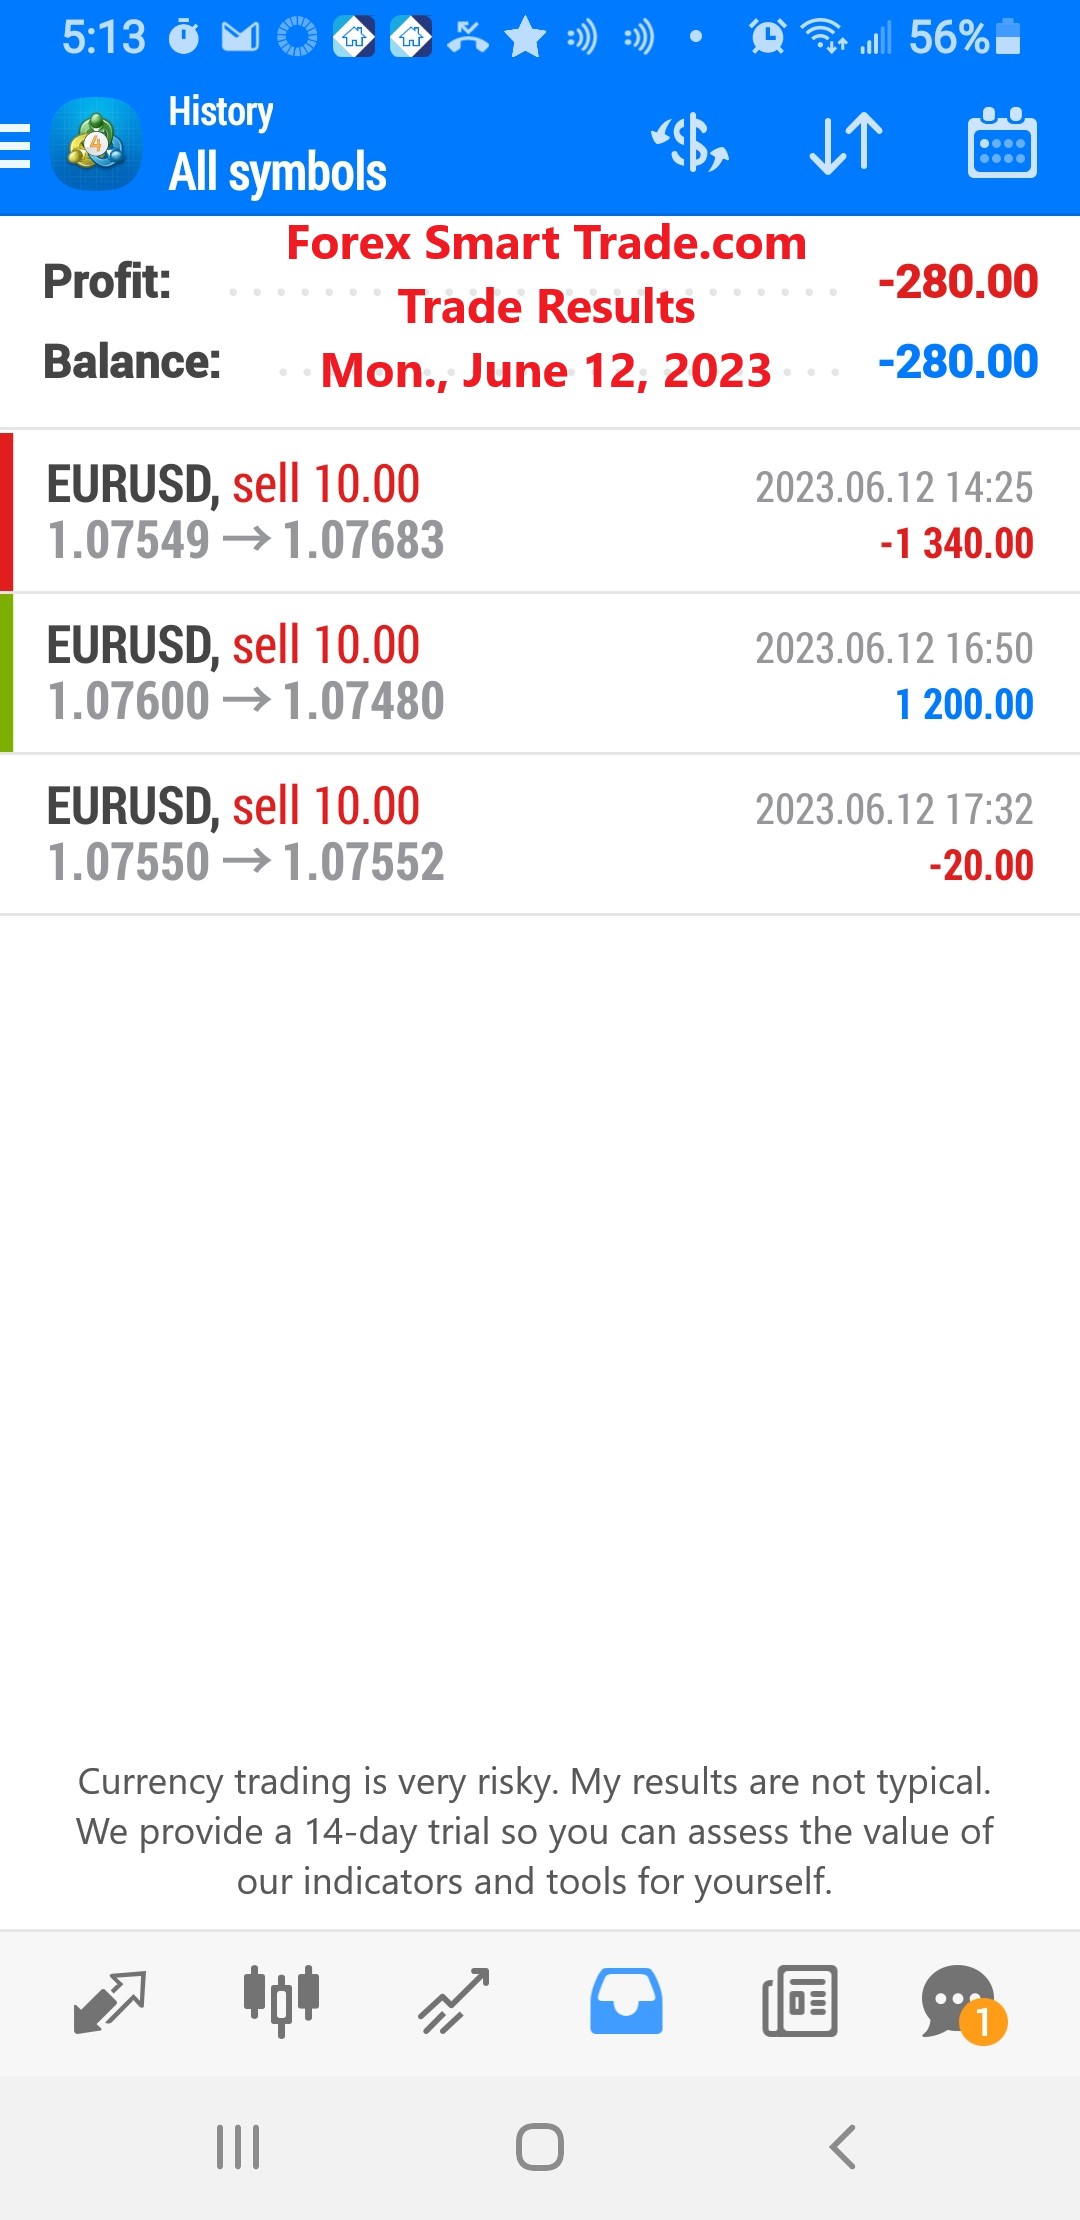
Forex Smart Trade Results, Monday, June 12, 2023 – ($280)
How to Trade Using MACD. Let’s take a look at how to trade using MACD. Because there are two moving averages with different “speeds”, the faster […]

Forex Smart Trade Results, Friday, June 9, 2023 – $9,867
The MACD Line. The Signal Line is the moving average of the MACD Line. When looking at the indicator, we consider the Signal Line the “slower” moving average. […]

Forex Smart Trade Results, Thursday, June 8, 2023 – $0
How to Use the MACD Indicator. Let’s take a look at how to use the MACD indicator. What is MACD? MACD is an acronym for Moving Average Convergence Divergence. This technical […]